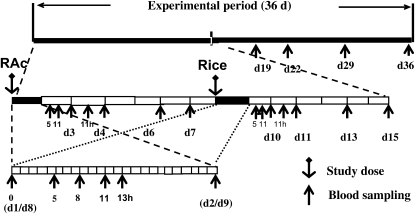
FIGURE 2.
Experimental design for the Golden Rice human study. Three sets of dashed lines are used to amplify the overall time period to progressively larger scales. The first order (upper scale) includes the entire 36-d study and sampling period. The second order (middle scale) represents days 1–15 of more frequent blood sampling. Each cell on the horizontal time axis represents a 24-h period, with the division line representing the fasting blood collection time (0 h). The cells in black represent days 1 and 8, the days on which the tracers were ingested. The third order (lower scale) is common for these 2 dosing and high-multiple blood-sampling days (days 1 and 8), with each cell on the time axis representing 1 h. The 0 time represents the first blood sampling of the day, and all other numbers represent the times of subsequent sampling (in h) relative to the time of first sampling. The anchor symbols represent the oral dosing of the tracer. The arrows indicate the times at which blood samples were collected. d, day in the study; h, hour after study dose or after fasting blood sample, RAc, retinyl acetate.

