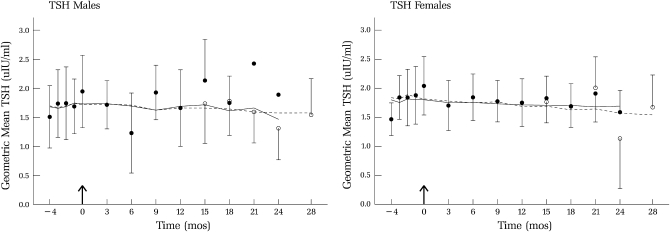
FIGURE 3.
Geometric mean (±SEM) thyrotropin (TSH) concentrations during baseline (−4 to 0 mo) and over 28 mo of selenium supplementation (200 μg/d) in men and women; n varied over time (see Table 2). Data collected before October 2002 (•) and estimates of data collected after month 12 (○) are shown as indicated in the text.

