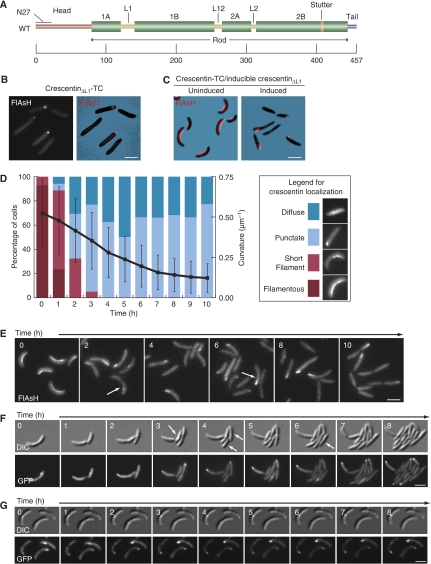
Figure 2.
Cell straightening upon dominant-negative crescentinΔL1 production is gradual and growth dependent. (A) Crescentin domain organization. Amino acid positions are shown at the bottom. Green bars indicate coiled-coil forming regions. The N-terminal head, C-terminal tail, linkers, stutter (interruption in coiled-coil repeat) and N27 region are marked. (B) FlAsH-stained cells expressing crescentinΔL1-TC in a ΔcreS background (CJW1521; CB15N ΔcreS pMR20creSΔL1-tc). (C) FlAsH-stained cells (CJW2788; CB15N ΔcreS xylX∷pHL23PxylcreSΔL1/pMR20creS-tc) expressing wild-type crescentin-TC (red), without (left) or with (right) co-expression of untagged crescentinΔL1 for 10 h. (D) Graphical representation of cell curvature loss and crescentin localization during crescentin structure disruption. Coloured bars show the fraction of cells (left axis) with each crescentin localization pattern at each time point. The black line shows mean cell curvature in μm−1 for a population of cells (713<n<1919) at each time point (right axis); error bars indicate standard deviation. (E) Representative FlAsH-stained cells of CJW2788 strain taken at the noted intervals after addition of the xylose inducer of crescentinΔL1 synthesis. Only wild-type crescentin-TC is visualized with FlAsH. White arrows denote cells in which crescentin displays punctate localization pattern but that still retain some curvature. (F) CJW2778 cells preincubated in M2G+ with 0.3% xylose for 2 h, then mounted on M2G+ agarose pads with 0.3% xylose and imaged at the indicated time intervals. Arrows indicate examples of straight daughter cells produced by growth in the absence of an intact crescentin structure. (G) Experiment as in (F), but with 10 μg/ml chloramphenicol added to the agarose pad to halt cell growth. Bars, 2 μm.

