Figure 4.
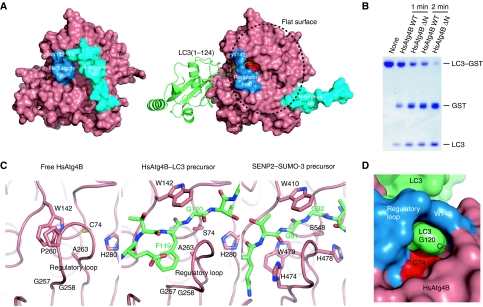
Conformational change in HsAtg4B upon complex formation with LC3. (A) Surface model of free (left) and LC3(1–124)-bound (right) HsAtg4B. W142 and the regulatory loop are coloured blue, and the N-terminal tail is coloured cyan. The catalytic Cys74 is coloured red. LC3(1–124) is shown as a ribbon model. (B) In vitro proteolysis assay using N-terminal tail-deleted HsAtg4B. LC3–GST was incubated with either wild-type or N-terminally truncated HsAtg4B and was subjected to SDS–PAGE analysis. (C) Structural comparison between free and LC3(1–124)-bound HsAtg4B and SENP2–SUMO-3 precursor complexes. Left, free HsAtg4B; middle, the HsAtg4B–LC3 precursor complex; right, the SENP2–SUMO-3 precursor complex. The three structures are shown in the same orientation. Model colouring is the same as in Figure 3. (D) Surface model of LC3(1–120) bound to HsAtg4B. Atom colouring is the same as in (A).

