
Figure 1.
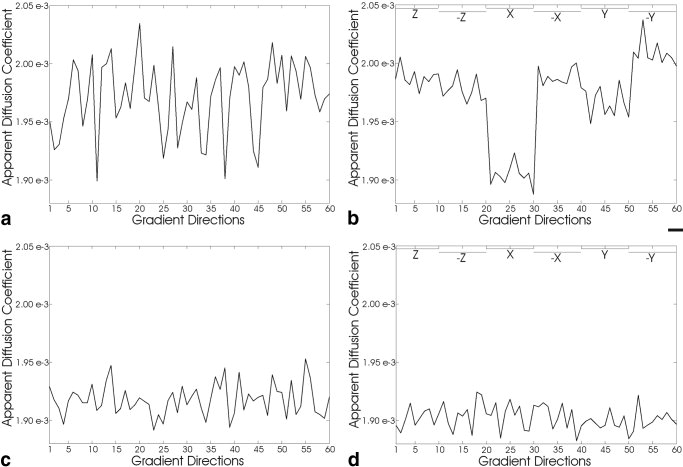
ADC values along different gradient directions. Two different experiments are described each performed without (top) and with (bottom) gradient corrections. The y-axis is scaled identically for all plots in units of mm2/s. In (a) and (c) the ADC values were calculated from seven images with b = 100 s/mm2 and 61 noncollinear directions distributed on the surface of a hemisphere with b = 1000 s/mm2 (for uniformity only 60 are shown). In (b) and (d) the ADC values were calculated from seven images with b = 100 s/mm2 and 10 images along both the positive and negative direction of each of the physical gradient axes with b = 1000 s/mm2 (see the top of each plot for indication of the gradient). The experiments were performed on a water phantom where isotropic diffusion is expected. a: Shows a high degree of variability in ADC values along the different directions. The variance is much higher than would be expected from the SNR of the images. b: Demonstrates that the variability in (a) is due in a large part to a systematic difference of ADC values along the different gradient axes. c and d: The results of the same two experiments as in (a) and (b) respectively after the gradient amplitudes were rescaled based on the methods described in this work (using Eq. [6]).