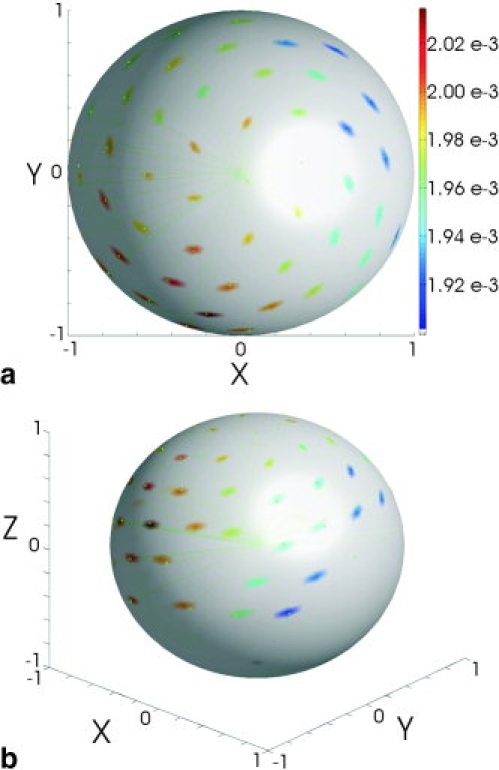
Figure 2.

Three-dimensional display of ADC values in a common diffusion-weighted experiment. The data from Fig. 1a is plotted on the surface of a sphere. The tip of each of the gradient directions is color coded with the measured ADC value along that direction in units of mm2/s. a: Displays a view looking down the positive z axis. Note the large variability in ADC values at any given y coordinate when moving along x between ±1. In contrast there is much less variability along y at any given x coordinate. This observation is confirmed by the experiment, in which only ±x, ±y, and ±z gradients are used to encode diffusion (see Fig. 1b). b: Shows the same data as in (a) but from a side view.
