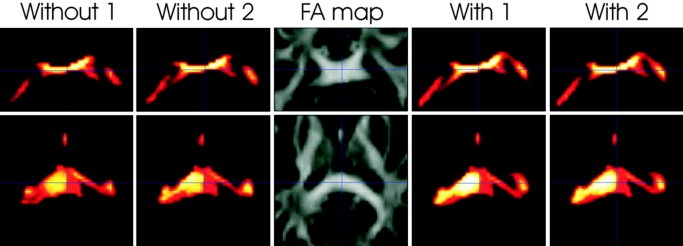
Figure 3.

Comparison of PICo maps based on datasets with and without gradient rescaling. The same region is displayed in all five image sets. The top row is a coronal view and the bottom row is an axial view of the splenium of the corpus callosum. The middle plot displays the FA map. The two image sets to the left of the FA map are PICo maps based on image sets which were collected without correcting the gradients. To the right of the FA map are PICo maps based on image sets which were collected after the gradients were rescaled according to Eq. [6]. The value of each pixel is between zero and one and represents a probability of connectivity. The two PICo maps with the rescaled gradients show a higher degree of connectivity. [Color figure can be viewed in the online issue, which is available at www.interscience.wiley.com.]
