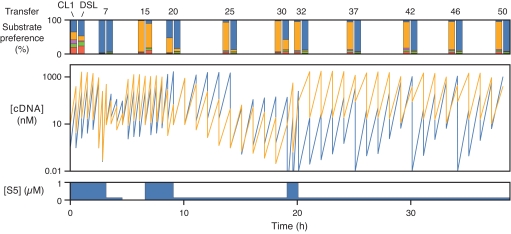
Fig. 2.
Time course of 50 transfers of continuous coevolution in the presence of 5 different substrates. The concentration of the CL1 (orange) and DSL (blue) enzymes was determined (based on their respective cDNAs) before and after each transfer. Paired bar graph at the Top indicates the substrate preference of each enzyme (CL1 at Left, DSL at Right) after various transfers when provided 1 μM S1 (red), S2 (green), S3 (purple), S4 (orange), or S5 (blue). Stepped graph at the Bottom indicates the concentration of S5 present during the coevolution experiment; all other substrates were present at 1 μM concentration throughout.

