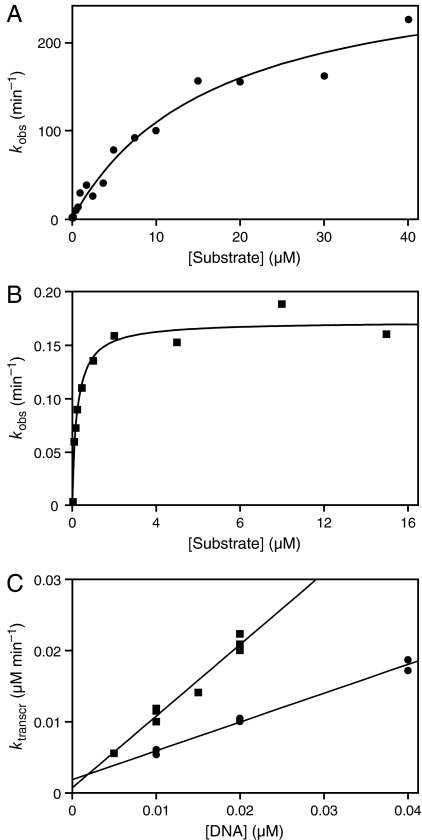
Fig. 5.
Catalytic activity and transcription rate of the evolved CL1 (circles) and DSL (squares) enzymes. (A) Reaction of CL1 with S4. (B) Reaction of DSL with S5. Data were fit to the Michaelis–Menten equation; curvilinear regression coefficients were 0.984 and 0.981 for CL1 and DSL, respectively. (C) Transcription rates were measured by using various concentrations of RNA/cDNA heteroduplex templates. Linear regression coefficients were 0.994 and 0.983 for CL1 and DSL, respectively.

