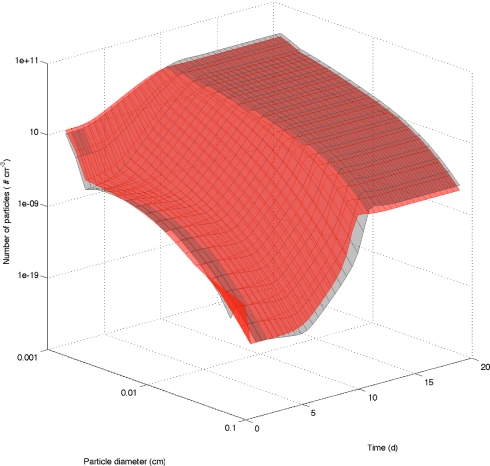
Fig. 5.
3D surface plots of particle number spectra from a model of algal floc formation by coagulation, using a curvilinear kernel (gray) and the intermediate Re kernel (red). Particle image diameter quantifies aggregate size; note the log scale on both x and z axes. Algal cell diameter = 10 μm, z = 20 m, η = 1 day−1, α = 0.25, initial algal cell concentration = 0.1 cm−3. Models do not include Brownian or shear coagulation kernels.

