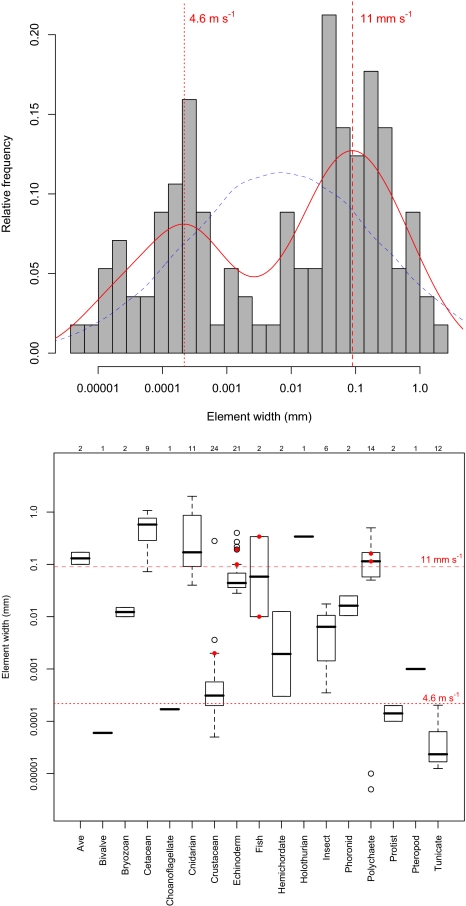
Fig. 6.
Collecting element sizes in filter feeders. (A) Frequency histogram of log(collecting element width) for n = 113 filter feeders and corresponding density function (red line). Note the bimodal distribution of element sizes (for comparison, the dashed blue line gives the density function for a lognormal distribution with the same mean and variance as the data). Vertical red lines indicate the (free-stream) water velocity required to give Rec = 1 at the bimodal peaks (note the difference in units between the two). (B) Box-and-whisker plot of element widths grouped within operational taxonomic units. Upper x axis gives the number of species in each group. Red horizontal lines are as vertical lines in main figure. Red dots are species reported to feed in the lab or field at Rec ≥ 1 (range 1 to 30) ((10–17);n = 9). All estimates assume μ/ρ = ν = 1 × 10⁻⁶.

