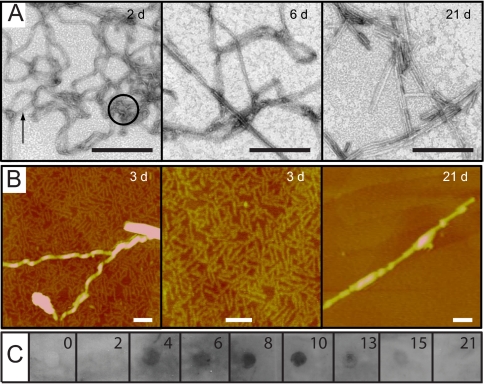
Fig. 3.
Characterization of the PI3-SH3 aggregation process under PF conditions. (A) Electron micrographs obtained for Δtagg of 2, 6, and 21 days. The circle indicates a protofibril and the arrow shows a flat-ribbon-like fibril. (Scale bar, 200 nm.) (B) AFM images obtained for Δtagg of 3 and 21 days. (Scale bar, 100 nm.) (C) Kinetics of oligomer-specific immunoreactivity. At the times indicated, aliquots were applied to a nitrocellulose membrane and probed with the oligomer-specific antibody, A11.

