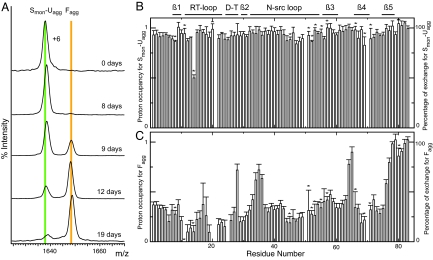
Fig. 4.
PI3-SH3 pulse-labeled samples prepared under AM conditions. (A) ESI-MS mass spectra (+6 charge state). The spectra show the relative populations of Smon-Uagg and Fagg at the indicated Δtagg times. Peak intensities are normalized to the overall species population. (B) Exchange profile for Smon-Uagg obtained from NMR data of samples prepared after Δtagg of 8 days. (C) Exchange profile for Fagg obtained by deconvolution of the NMR data of samples prepared after Δtagg values of 10, 11, 12, 13, 17, and 19 days by using the distribution of populations obtained by ESI-MS analysis and the NMR exchange profile for the Smon-Uagg species. (B and C) The bars represent the proton occupancy and percentage of exchange for each residue. The locations of the β-sheet strands, turns, and loops in the native state of PI3-SH3 are indicated above the graph. An asterisk above a bar indicates a residue whose resonance is not fully resolved; the absence of a bar indicates that the resonance of the residue is not detectable or that the residue is proline that does not have an amide hydrogen (residues 50, 70, and 84).

