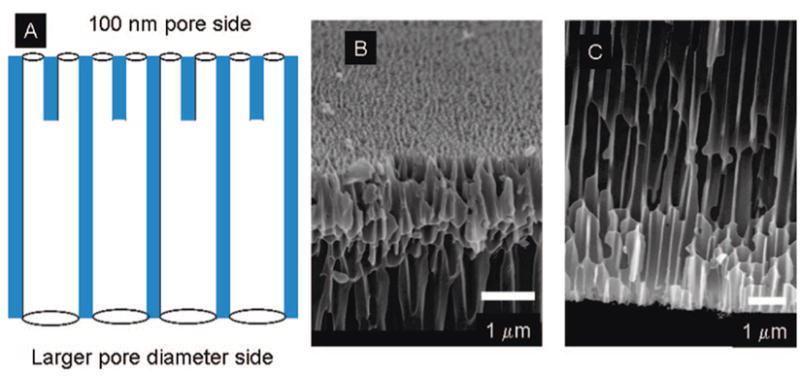
Figure 7.

(A) Schematic diagram of 100 nm Anodisc (Whatman) showing the branching of the pores. The blue shaded area represents alumina and white area represents pore (air). (B) Scanning electron micrograph (SEM) of smaller pore diameter side (~70–100 nm). (C) SEM of larger pore diameter side (200–300 nm).
