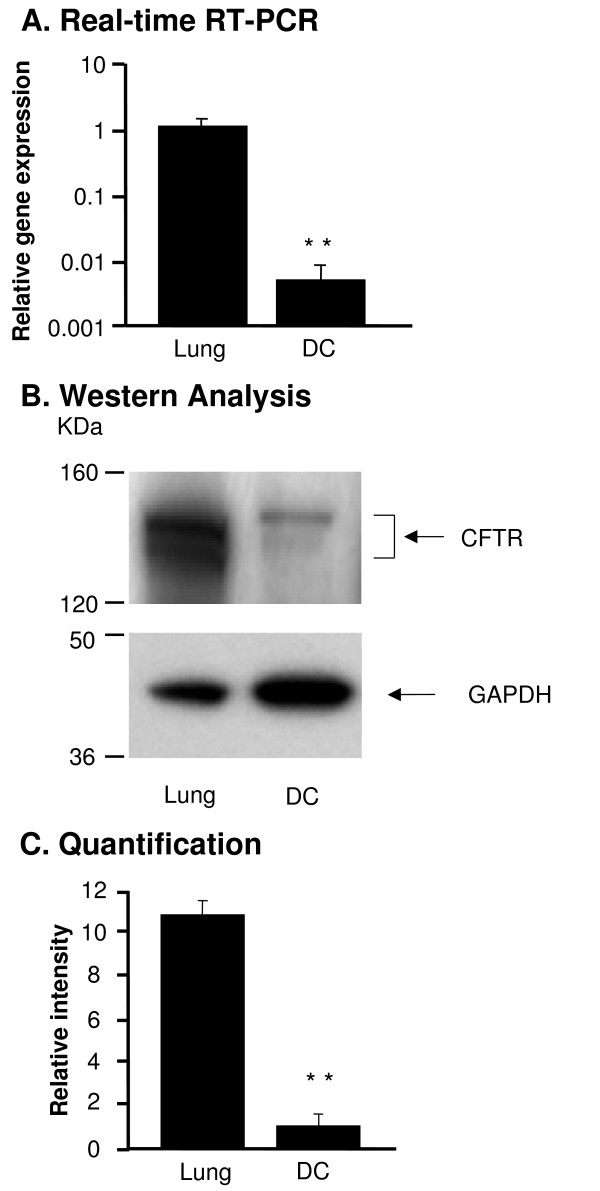
Figure 1.
CFTR expression in bone marrow derived dendritic cells (DC). RNA and protein were extracted from wild type (WT) mouse lung and DC. CFTR expression was measured by real-time RT-PCR and Western analysis. A. Real-time RT-PCR. WT mouse lung tissue was used as a positive control and calibration. The y-axis represents CFTR cDNA transcription level in terms of relative quantity value (RQ). B. Western analysis of CFTR protein in DC compared to the WT lung tissue. C. Quantification of CFTR protein by image intensity analysis. Images were scanned and analyzed by software Image J normalized to GAPDH loading control. Shown is the mean ± SEM of three pairs of independent samples. **denotes p < 0.01.

