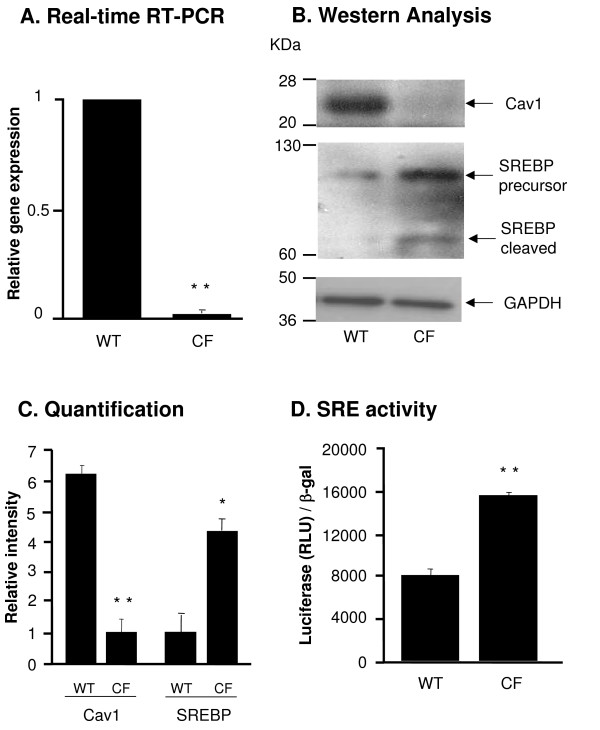
Figure 4.
Cav1 and SREBP expression in DC from WT and CF mice. A. RNA was extracted from DC from WT and CF mice and Cav1 gene expression was measured by Real-time RT-PCR. Relative expression levels in the samples were calculated using the ΔΔCt method, with GAPDH as internal normalization control. The y-axis represents Cav1 cDNA transcription level in terms of relative quantity value (RQ). B. Western analysis of Cav1 and SREBP in DC from WT and CF mice and corresponding GAPDH expression. C. Quantification of Cav1 and SREBP expression by image intensity analysis normalized to GAPDH. D. Luciferase assay of SRE transcriptional activity in CF and WT DC. DC were infected with AdZ-SRE-luc for 48 h and harvested for luci-ferase assay and β-galactosidase assay. Data is shown luciferase activity (RLU) normalized to β-galactosidase. Shown is the mean ± SEM of three of independent samples. *denotes p < 0.05, ** denotes p < 0.01.

