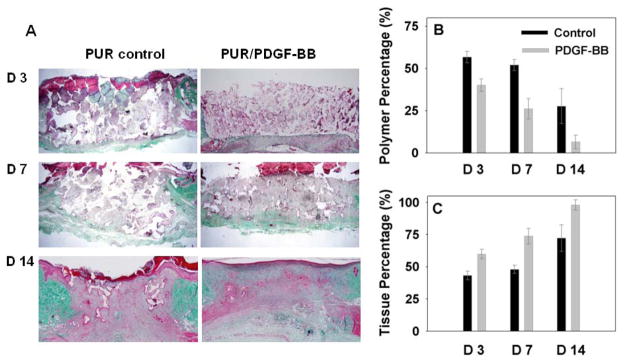
Fig. 7.
Trichrome staining and quantitative evaluation of in vivo implants. In the representative images (A), the white, red, and green sections represent the presence of polymer, tissue, and collagen deposition respectively. The area percentage of polymer and new granulation tissue within the implants at each time point are shown in (B) and (C).

