
Fig. 4. Correlation analysis between behavioral impairments in the forced swim test (FST) and plasma CORT levels in post-SE animals.
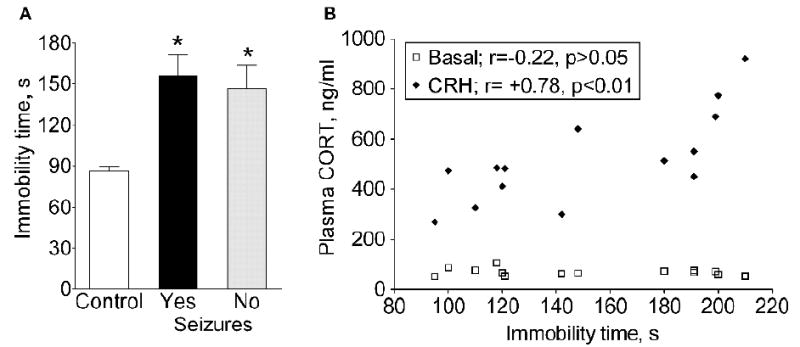
A. Immobility time in the FST in control animals (n=8, open bar), in post-SE animals with (n=8, black bar) and without (n=6, gray bar) documented spontaneous seizures. Data are presented as Mean±SEM. *- p<0.05 vs. Control (One-Way ANOVA + Neuman-Keuls). B. In individual animals, the immobility time is plotted against previously obtained basal CORT concentration (open squares) and CORT concentration 30 min after CRH injection (black diamonds). No correlation was observed between the severity of behavioral deficit and either basal CORT concentration (r=-0.22, p>0.05, Pearson correlation), or that after DEX injection (r=0.14, p>0.05, not shown); however, the severity of depressive behavior positively correlated with CORT concentration 30 min after CRH injection (r=+0.78, p<0.01, Pearson correlation) and 60 min after CRH injection (r=+0.61, p<0.05, not shown).