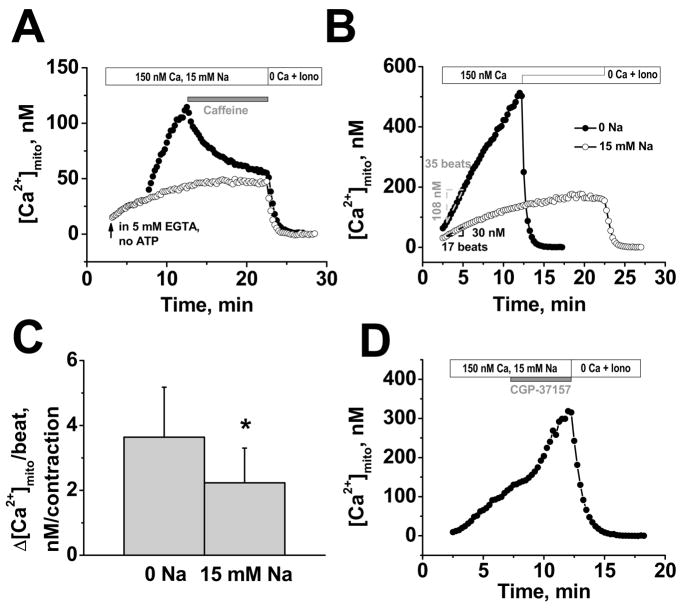
FIGURE 5. Calibrated rise in [Ca2+]mito per beat and [Na+]i-dependence.
A, 10 mM caffeine stops [Ca2+]mito, but with 15 mM Na+ [Ca2+]mito declines (filled symbols); mitochondrial Ca2+ uptake in presence of 5 mM EGTA (empty symbols). B, examples of [Ca2+]mito increase per contraction (±15 mM Na+). C, Average increase of [Ca2+]mito per contraction (±15 mM Na+). D, Blockade of NCXm (5 μM CGP-37157) increases rate of [Ca2+]mito rise in presence of 15 mM Na+. Each experiment ended with Ca2+-free solution with ionophores (Iono) to start calibration.

