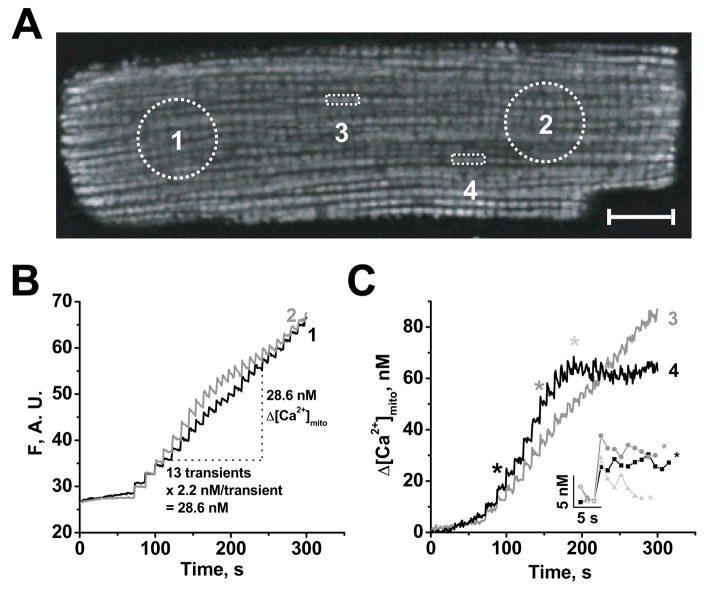
FIGURE 6. Spatially resolved [Ca2+]mito during SR Ca2+ release.
A, confocal image of permeabilized rat ventricular myocyte loaded with 10 μM rhod-2 AM, after 5 min of spontaneous Ca2+ transients in 15 mM Na+ (with 80 μM cytochalasin D) with 4 regions of interest (ROI) indicated. Scale bar is equal 10 μm. B-C, Time courses of [Ca2+]mito in 4 ROIs, either as fluorescence (F in arbitrary units, B) or calibrated Δ[Ca2+]mit (C) using averaged Δ[Ca2+]mito/beat from Fig. 5C (see B and text). C, ROI 3 and 4 contain 3 mitochondria and inset shows the indicated [Ca2+]mito transients expanded.

