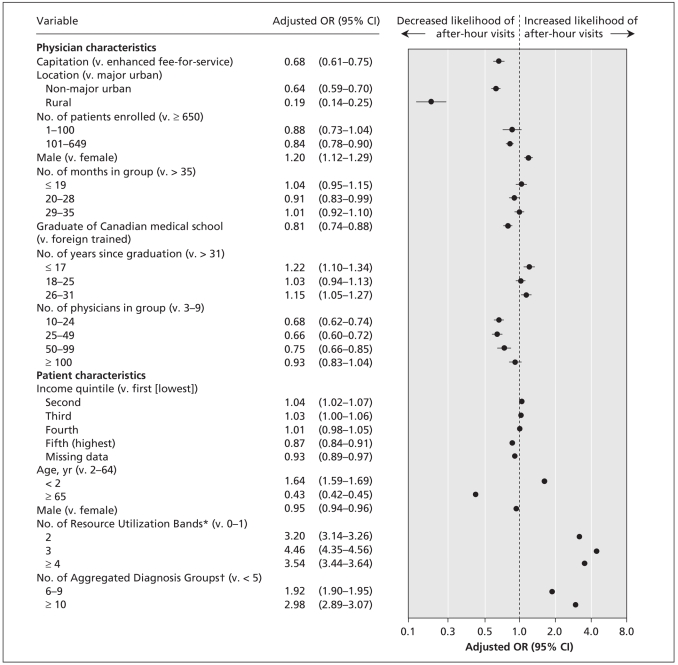
Figure 1.
Adjusted odds ratios (ORs) of after-hours visits among patients whose physicians were reimbursed through a blended capitation model compared with patients whose physicians were reimbursed through an enhanced fee-for-service model. Adjustments were made for the physician and patient characteristics listed in the figure. Values less than 1.0 indicate fewer after-hours visits in the capitation model than in the enhanced fee-for-service model. CI = confidence interval. *Resource Utilization Bands categorize patients according to their morbidity and corresponding expected use of health care resources; they range from 0 (lowest expected health care costs) to 5 (highest expected health care costs). †Aggregated Diagnosis Groups indicate a patient’s level of comorbidity, ranging from 0 (no diagnosis group) to ≥ 10 (at least 10 distinct diagnosis groups).

