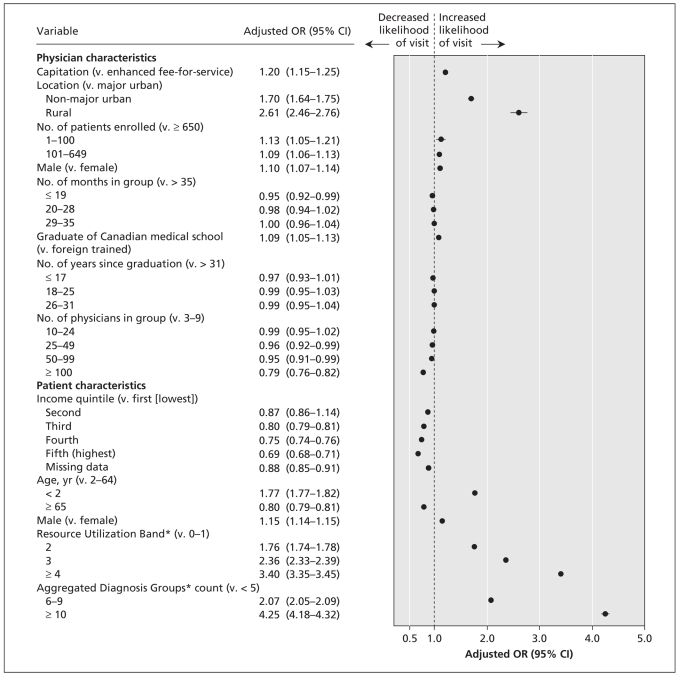
Figure 2.
Adjusted odds ratios (ORs) of use of emergency department visits among patients whose physicians were reimbursed through a blended capitation model compared with patients whose physicians were reimbursed through an enhanced fee-for-service model. Adjustments were made for the physician and patient characteristics listed in the figure. Values greater than 1.0 indicate more visits to an emergency department in the capitation model than in the enhanced fee-for service model. CI = confidence interval. *See caption of Figure 1 for explanations of Resource Utilization Bands and Aggregated Diagnosis Groups.

