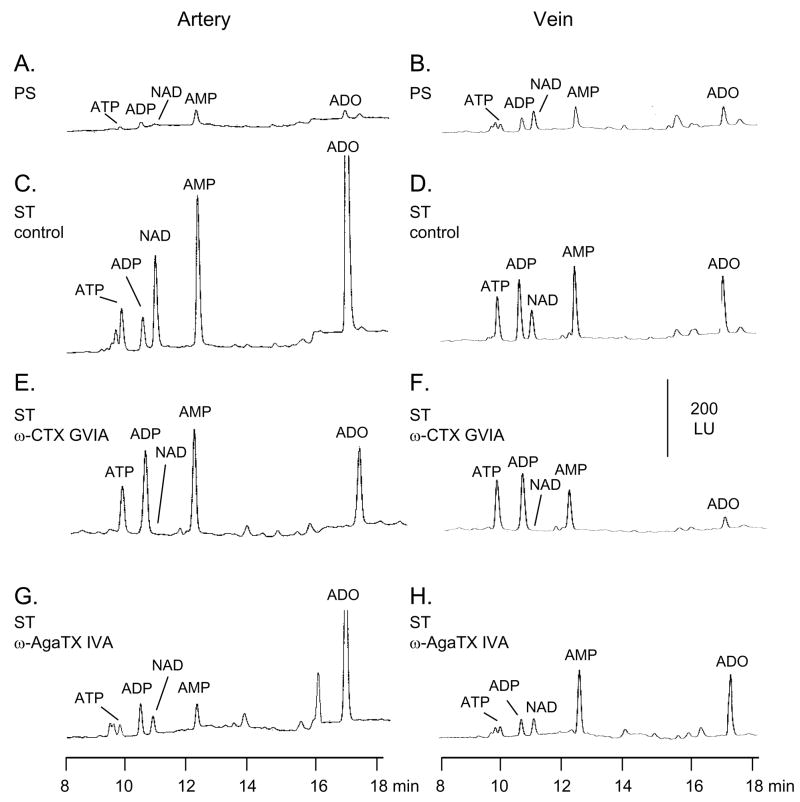
Fig. 4.
HPLC-fluorescence detection analysis of purine release upon EFS (16 Hz, 0.3 ms, 120 s) in canine isolated mesenteric artery (left column) and vein (right column). Original chromatograms are shown from tissue superfusate samples collected before (pre-stimulation, PS, A and B) and during EFS (stimulation, ST) in the absence (control - C, D) and presence of ω-CTX GVIA (5 nM – E, F), and ω-AgaTX IVA (20 nM – G, H). The amount of vascular segments loaded per chamber was 62.0 ± 0.5 mg wet weight for the artery and 58.0 ± 1.0 mg wet weight for the vein (P>0.05). Scales apply to all chromatograms.

