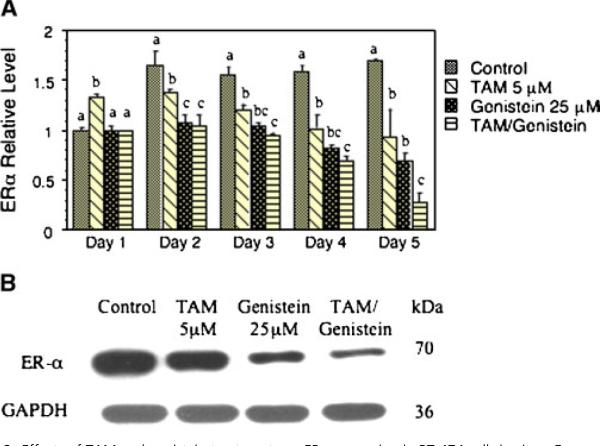
Figure 6.
Effects of TAM and genistein treatments on ERα expression in BT-474 cells in vitro. Gene expression was quantitated by real-time PCR. Results are expressed as mean ± SD (A). Each experiment was duplicated and repeated at least twice. Within each time point, the means without a common superscript letter are significantly different with P values at least <0.05. A representative of protein expression for ERα with indicated treatments for 3 d is shown in panel B. [Color figure can be viewed in the online issue, which is available at www.interscience. wiley.com.]

