
Figure 2.
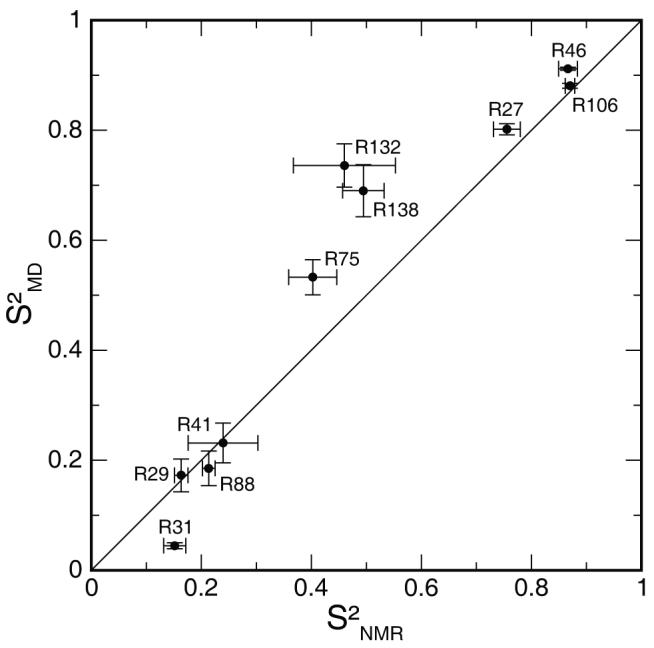
Experimental vs. simulated arginine Nε order parameters. Experimental error bars were derived as described in Materials and Methods. Simulated error bars indicate the standard error of the mean over sixteen 10 ns blocks.
Official websites use .gov
A
.gov website belongs to an official
government organization in the United States.
Secure .gov websites use HTTPS
A lock (
) or https:// means you've safely
connected to the .gov website. Share sensitive
information only on official, secure websites.
Experimental vs. simulated arginine Nε order parameters. Experimental error bars were derived as described in Materials and Methods. Simulated error bars indicate the standard error of the mean over sixteen 10 ns blocks.