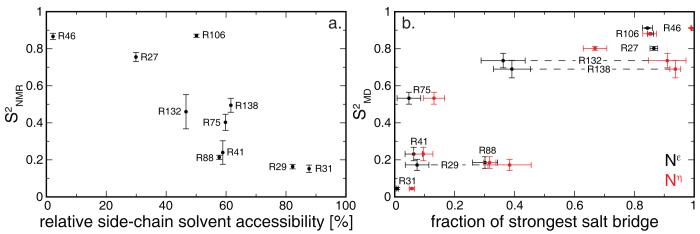
Figure 3.
Structural determinants of Nε flexibility. (a) Relative side-chain solvent accessibility, calculated from the crystal structure of RNase H (PDB code 2RN2)39 using NACCESS,50 vs. experimental order parameters. (b) Average maximal fraction of time the Nε-Hε moiety (black) or the two Nη-Hη moieties (red) of an arginine participate in a salt bridge during a 20 ns trajectory. Standard errors of the mean of the salt-bridge fractions calculated over the eight 20 ns trajectories are shown. Dashed lines connect data points belonging to the same residue when needed for clarity.

