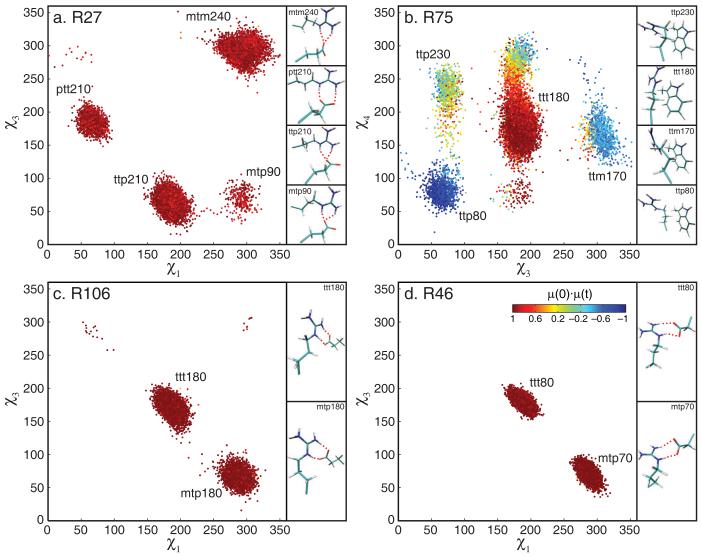
Figure 5.
Two-dimensional χ-angle plots for select arginine residues. For R27, R75 and R106, every 10th conformation from all eight 20 ns trajectories is shown; for R46 every 7th conformation from the extended 117 ns trajectory is shown. Conformations are color-coded with respect to the scalar product of the orientation of the Nε-Hε bond vector and its orientation in the first snapshot according to the color bar in the plot of R46. Representative structures of the respective arginine side chain and its interaction partner are shown, with salt bridges indicated by red dashed lines.

