
Figure 6.
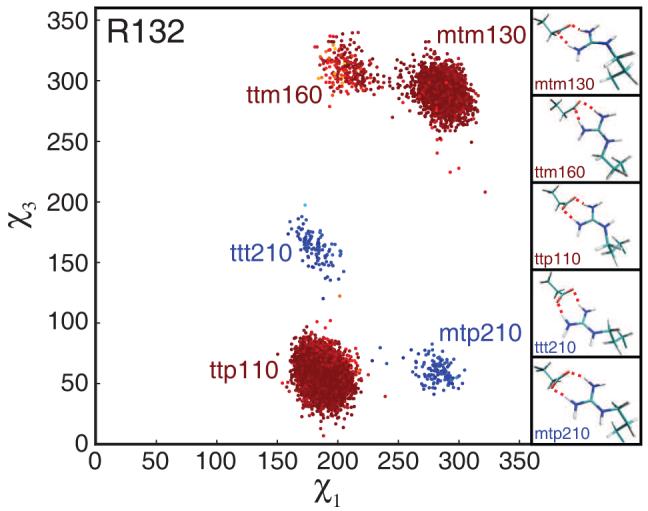
Two-dimensional χ-angle plot for R132. For clarity, every 10th conformation forming the salt bridge to E32 from all eight 20 ns trajectories is shown. Conformations are color-coded as in figure 5. In addition, the salt-bridge configuration of each conformation is indicated by the color of the corresponding rotamer label (red and blue). Representative structures are shown, with salt bridges indicated by red dashed lines.