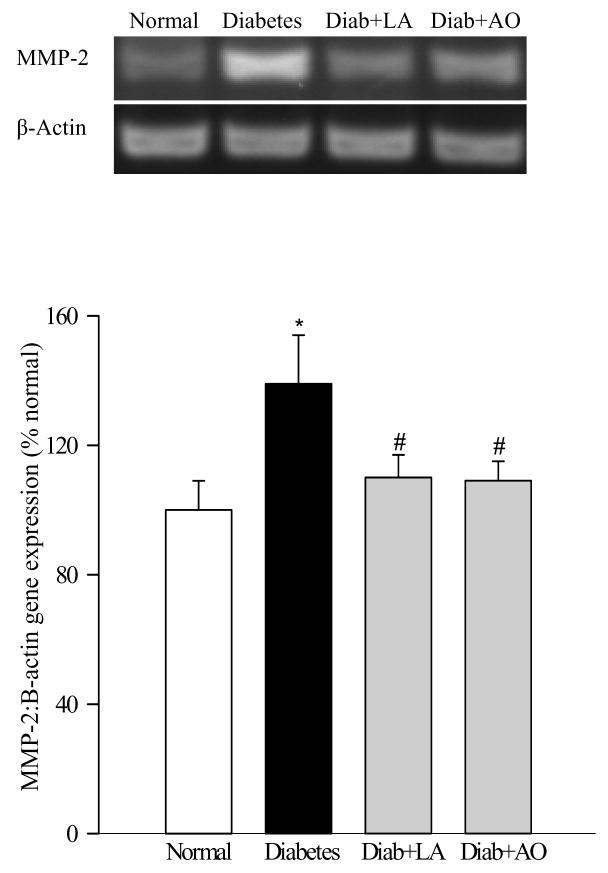
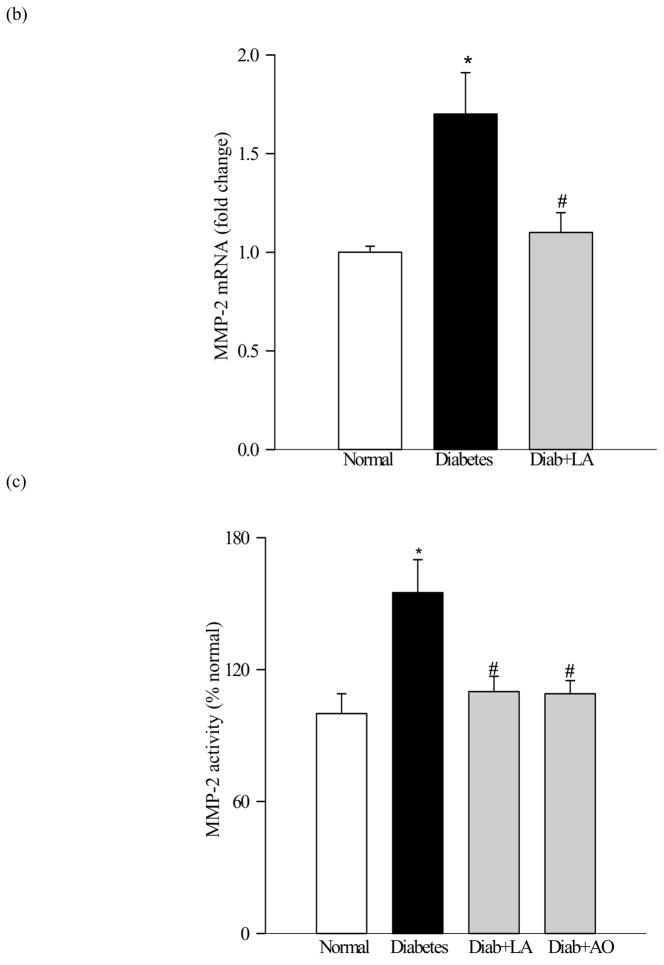
Figure 4.
Effect of long-term diabetes on retinal MMP-2: Retina from rats diabetic for 12 months receiving α-lipoic acid (Diab+LA) or antioxidants (Diab+AO), and age-matched normal rats was used to measure (a) gene expression of MMP-2 was determined by RTPCR using the primers given in table I. MMP-2 mRNA levels in each sample were normalized to β-actin levels, and (b) was quantified by real time PCR method using Taqman PCR primers. Fold-change relative to normal age-matched controls was calculated using the ddCt method. (c) Gelatinase activity by zymography. 10–20μg retinal protein was electrophoresed under non reducing conditions, incubated in substrate buffer and stained with Coomassie blue. Active MMP-2 (67kD) band was detected in the zymogram and quantified using Un-Scan-It Gel digitizing software. Retina from five to seven rats in each group was analyzed. *P<0.05 compared to the values obtained from the retina of age-matched normal rats, and #P<0.05 compared to retina of diabetic rats without any supplementation.


