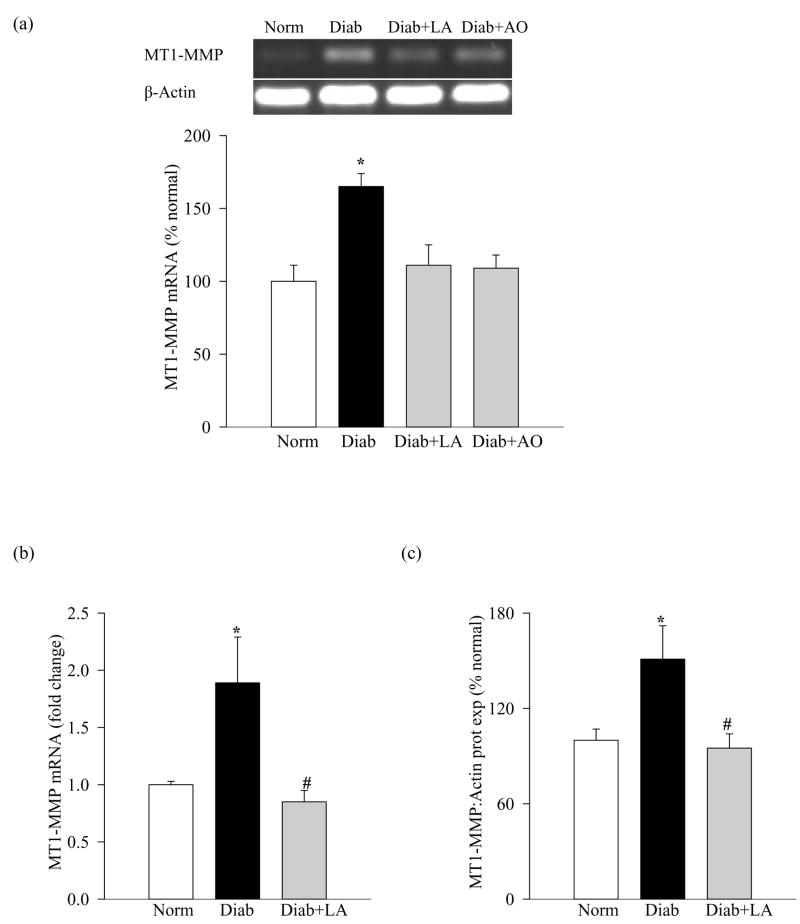
Figure 7.
Activation of MT1-MMP in retina in diabetes: MT1-MMP gene expression was measured in the same retina samples as used in figures 4 and 6 by (a) semi-quantitative PCR, and the histograms represent mRNA levels (mean ±SD) of the MT1-MMP adjusted to that of β-actin in the same sample from six or more rats in each group and quantitative (b) and by quantitative PCR methods (c) Protein expression of MT1-MMP was determined by western blot using mouse monoclonal antibody against MT1-MMP. The histograms represent protein expression of MT1-MMP adjusted to the expression of β-actin in the same sample. *P<0.05 compared to the values obtained from the retina of age-matched normal rats, and #P<0.05 compared to retina of diabetic rats without any supplementation.

