
Figure 2.
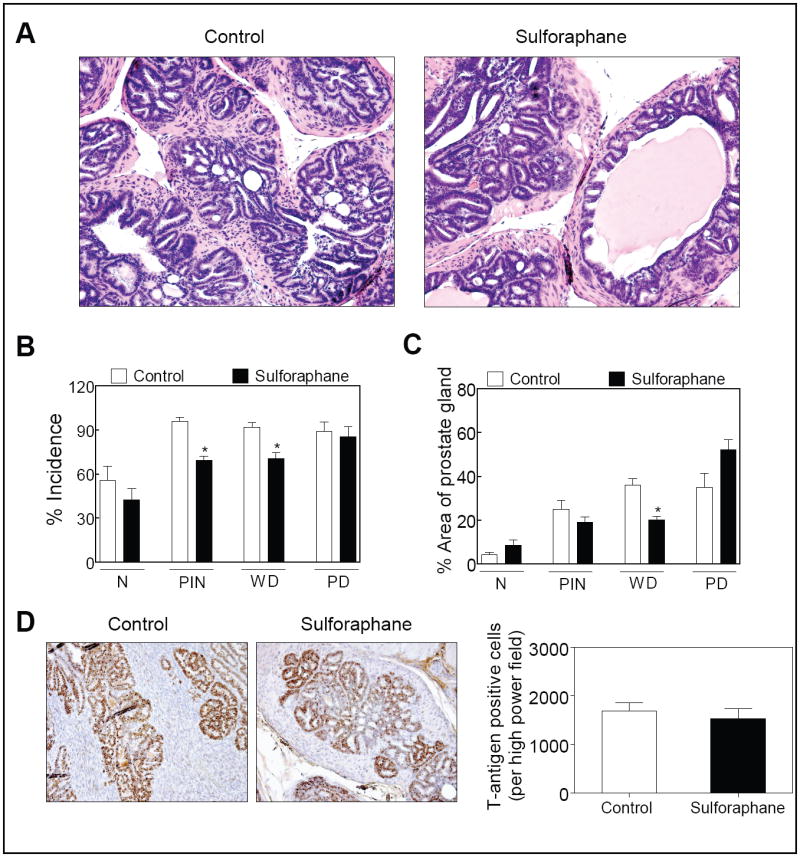
A, H&E staining in the dorsolateral prostate from representative mouse of both vehicle-treated control and SFN treatment groups (200× magnification). B, incidence of histological grades classified as normal prostate (N), PIN, WD carcinoma, and PD carcinoma in the dorsolateral prostate from vehicle-treated control mice and SFN-treated mice. Ten representative fields of each section were scored for incidence of each histological grade. The error bars represent variability of results in histological grading between the two researchers. C, percentage of the area corresponding to the normal prostate, PIN, WD carcinoma, and PD carcinoma in the dorsolateral prostate of control and SFN-treated mice. The scores of the two researchers were averaged and expressed as mean ± SE. In panels B and C *significantly different compared with control by Mann Whitney test. D, T-antigen expression in representative dorsolateral prostate of a control and a SFN-treated TRAMP mouse (200× magnification). The bar graph represents quantitative analysis of T-antigen expression. Columns, mean (n= 4), bars, SE.