
Figure 4.
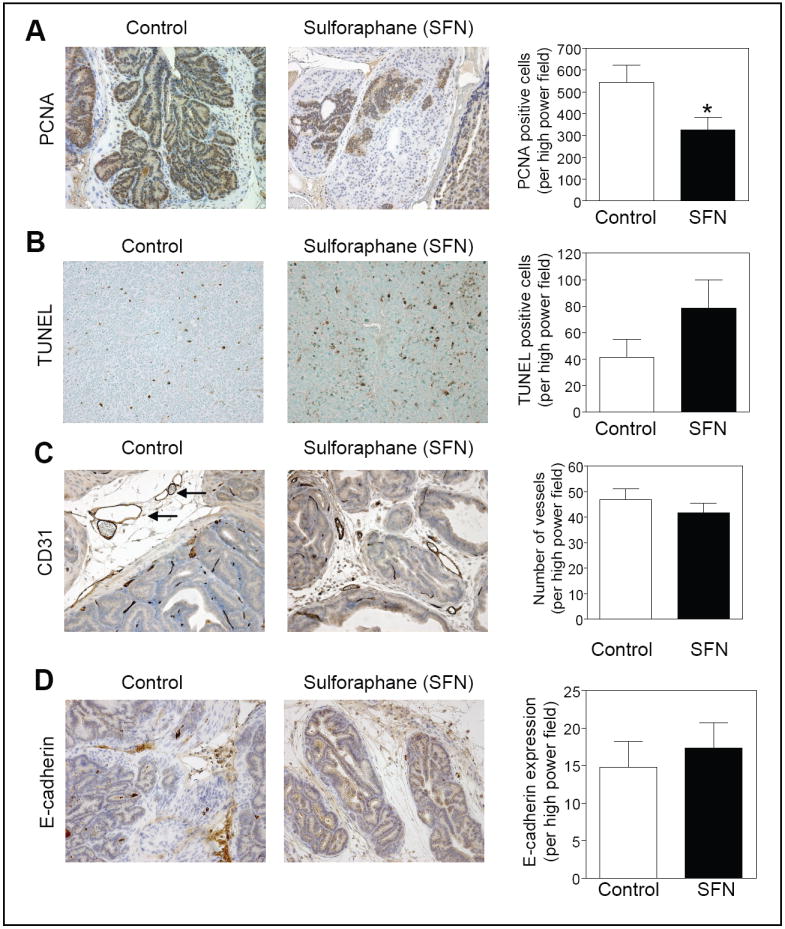
Analyses for (A) expression of PCNA, (B) TUNEL-positive apoptotic bodies, (C) CD31 to visualize blood vessels (identified by arrows), and (D) E-cadherin expression in the dorsolateral prostate of a representative mouse of both the control and SFN treatment groups (200× magnification). The panels on the right show quantitative results for each parameter. Columns, mean (n= 6-7), bars, SE. *Significantly different (P<0.05) compared with control by t-test.