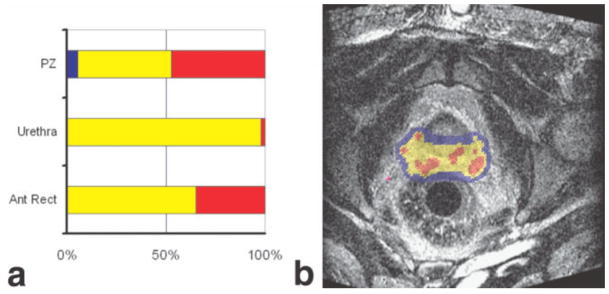
Figure 6.
MR-based brachytherapy planning. A screen capture of a treatment planning system used for MR-guided brachytherapy is shown. The large image (b) shows a real-time image with levels of radiation dose indicated by a color wash. Colors are used to indicate the relation between delivered dose and either the dose prescribed to the target or dose limits of the surrounding normal structures. Each structure is assigned a structure specific minimum and maximum dose. Dose summary graphs (a) show the fraction of each structure receiving below minimum (blue), between minimum and maximum (yellow), and over maximum (red). Normal structures will have a minimum dose of 0 and a maximum dose related to their tolerance of radiation. Target structures will have minimum dose that is the prescription dose and a maximum dose taken as 150% of the prescription. Due to the nature of brachytherapy, any target will have significant regions above the structure’s maximum dose. The regions of interest are delineated on a reference set of images taken at the beginning of the procedure. Dose is calculated based on needle locations as observed on images acquired during the course of the implant procedure. The planning system enables adaptive treatment planning.

