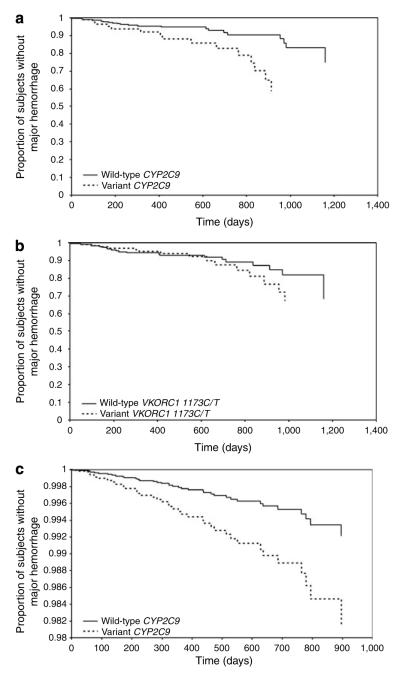
Figure 1.
Time to major hemorrhage by CYP2C9 and VKORC1 genotype. Kaplan—Meier curves for time to major hemorrhagic complication analyses plotted for (a) CYP2C9 wild-type vs variant genotype and (b) VKORC1 1173C/T wild-type vs variant genotype. (c) Estimated survival curve from Cox PH model adjusted for VKORC1 1173C/T genotype, age, warfarin dose, gender, body mass index, INR, alcohol intake, vitamin K intake, number of comorbid conditions, and drug interactions (note: y axis starts at 0.98).

