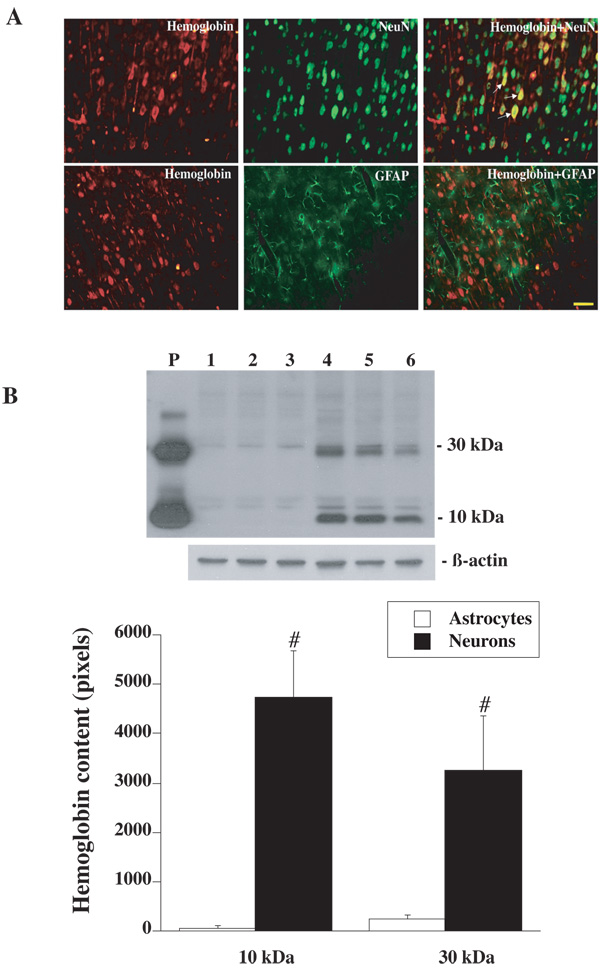
Figure 1.
(A) Double labeling of rhodamine-labeled hemoglobin with FITC-labeled NeuN (a neuronal marker) or GFAP (an astrocyte marker). Scale bar=50µm. (B) Western blot analysis showing Hb levels in primary cultured cerebral astrocytes (lanes 1 to 3) and neurons (lanes 4 to 6). Rat Hb was used as a positive control (P). Value are expressed as mean ± SD, n=3. #p<0.05 versus astrocytes.

