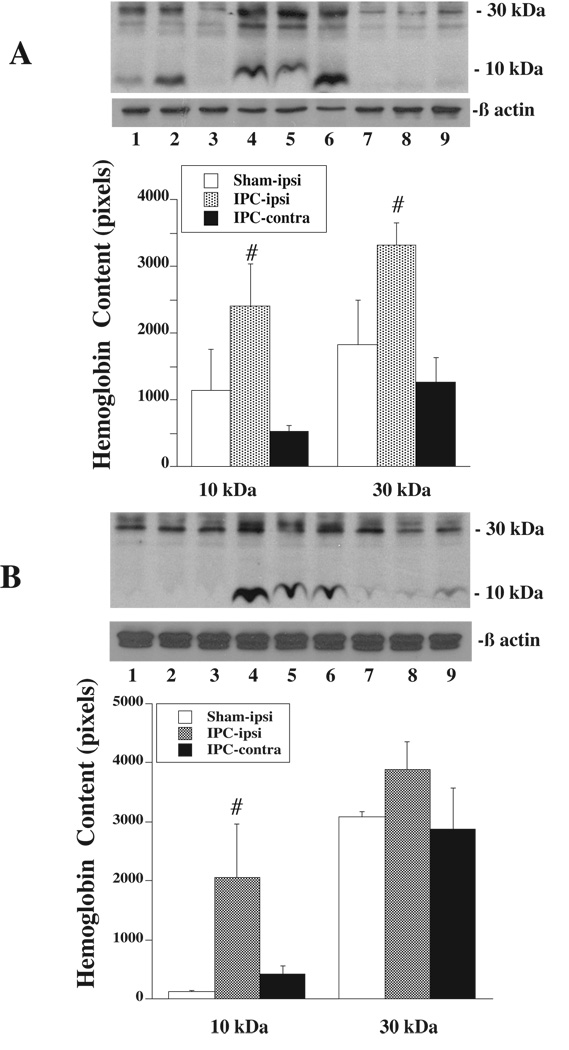
Figure 2.
Western blot analysis showing Hb levels in the caudate (A) and cortical core sample (B) 24 h after sham operation or 15 min of IPC. Lanes 1 to 3: the ipsilateral caudate or cortical core of shams; Lanes 4 to 6: the ipsilateral caudate or cortical core sample of IPC-treated rats; Lanes 7 to 9: the contralateral caudate or cortical core sample of IPC-treated rats. Value are expressed as mean ± SD, n=3. #p<0.05 versus the other groups.

