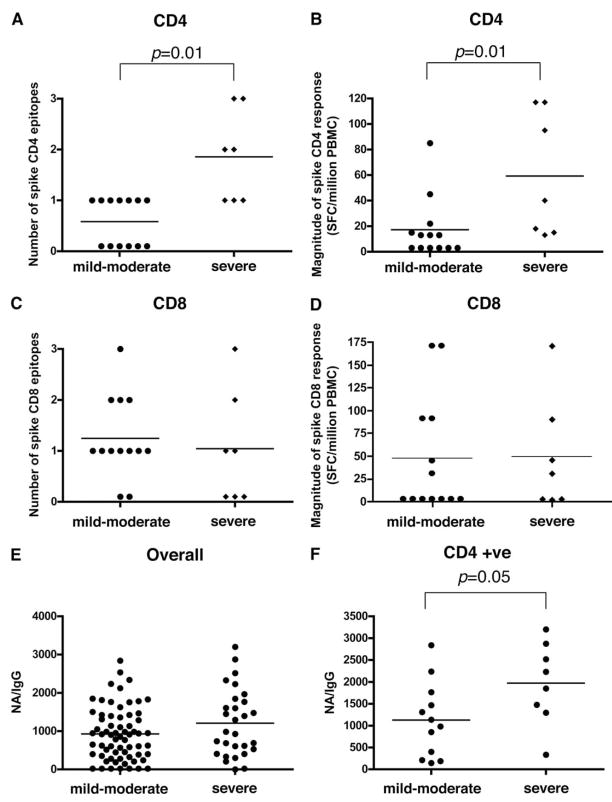
FIGURE 6.
T cell and Ab responses between mild-to-moderate and severe groups of convalescent SARS patients. A, Number of CD4+ spike responses, as represented on the y-axis, is compared between mild-to-moderate and severe groups, as measured by IFN-γ ELISPOT assay. B, Magnitude of CD4+ spike response as represented by SFC per million PBMC is compared between mild-to-moderate and severe groups. C, Number of CD8+ spike responses as represented on the y-axis is compared between mild-moderate and severe groups. D, Magnitude of CD8+ spike response as represented by SFC per million PBMC between mild-to-moderate and severe groups. E, The corrected neutralizing Ab response in all SARS samples studied, as represented on the y-axis, from all samples between mild-to-moderate and severe groups, as measured by SARS IgG and neutralizing Ab. F, The corrected neutralizing Ab response as represented on the y-axis from SARS patients (mild-to-moderate or severe groups) who have spike-specific CD4+ T cell responses. p values represent the results of a Mann-Whitney U test.

