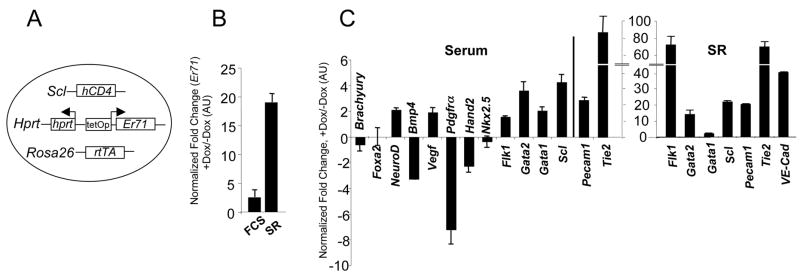
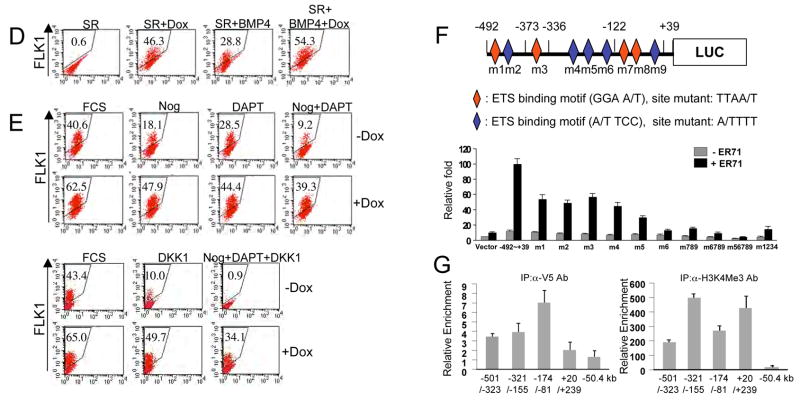
Figure 3. ER71 can induce FLK1+ mesoderm by activating Flk1 expression.
(A) Schematic diagram of the inducible ER71 (iER71) ES cells used, with indicated loci carrying alterations allowing for production of the rtTA, expression of the Er71 cDNA and generation of hCD4 as a surrogate marker for Scl. (B, C) Er71 induction upon Dox treatment and the ER71-mediated transcriptional program. iER71 ES cells were differentiated for 1 day in serum or for 2 days in SR and then treated with 1 μg/ml Dox for an additional 2 days. RNA was prepared and used for qRT-PCR. Genes were normalized against Gapdh and the ratio of the gene quantity (+Dox) to gene quantity (−Dox) was determined to yield normalized fold change. (D) iER71 ES cells were differentiated as described. BMP4 was added on day 2. The resulting cells were FACS analyzed for FLK1. Numbers in insets indicate the percentage of FLK1+ cells. (E) iER71 ES cells were differentiated in serum as described. Noggin, DAPT and DKK1, singularly or in combination, were added on day 1 of differentiation. Dox was added on day 1 and FLK1+ cells were analyzed on day 3. Numbers in insets indicate the percentage of FLK1+ cells. (F) (upper) Schematic diagram of the Flk1 promoter used for luciferase assay. Diamonds indicate potential Ets binding sites (red in sense and blue in anti-sense). For mutagenesis, potential Ets sites GGAA/T (sense) and A/TTCC (anti-sense) were mutated to TTAA/T and A/TTTT, respectively. (lower) 293T cells were transfected with pGL3 or pGL3-Flk1 promoter-luciferase reporter plasmid with or without pCS3-Myc-Er71(WT or MT). Fire fly luciferase activity was normalized by Renilla luciferase activity. (G) iER71 ES cells differentiated in serum in the presence of Dox were cross-linked, sonicated and subjected to ChIP assay. Numbers on the X-axis indicate the locations of amplicons of each qPCR primer set on Flk1. The value normalized against IgG IP values is shown on the Y-axis.


