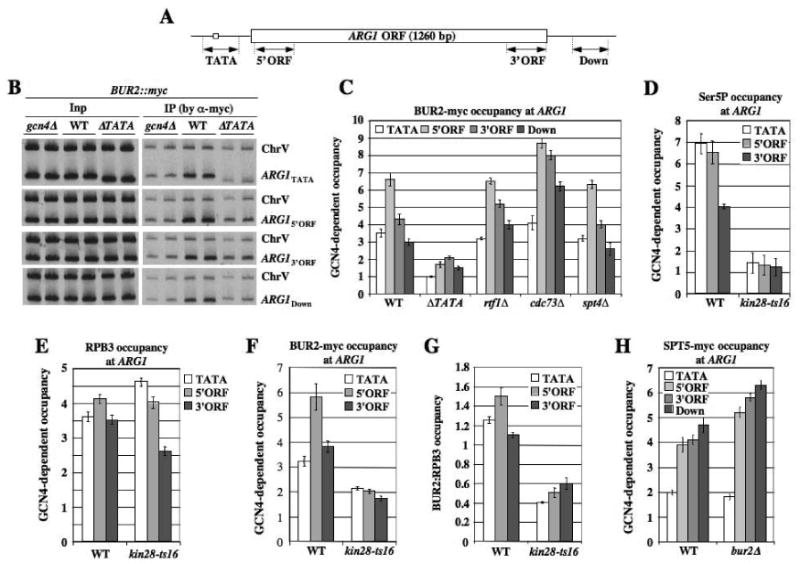
Fig. 1. Co-transcriptional recruitment of BUR2 to ARG1 is enhanced by KIN28.

(A) ARG1 locus showing regions subjected to ChIP analysis. (B, C) ChIP analysis of BUR2-myc binding at ARG1. BUR2::myc strains with the indicated mutations (HQY1002, HQY1003, HQY1051, HQY1004, HQY1007, HQY1008) were cultured in SC medium lacking Ile and Val and treated with sulfometuron (SM) for 30 min to induce GCN4, then subjected to ChIP analysis with myc antibodies. DNA extracted from immunoprecipitates (IP) and input chromatin (Inp) samples was subjected to PCR in the presence of [33P]-dATP with the appropriate primers to amplify radiolabeled fragments of ARG1 shown in (A) or a control fragment (ChrV). PCR products were resolved by PAGE and visualized by autoradiography, with representative results shown in (B), and quantified with a phosphorimager. The ratios of ARG1 to ChrV signals in IP samples were normalized for the corresponding ratios for Inp samples. The resulting values for the GCN4 strains were normalized to the corresponding values for the gcn4Δ strain to yield GCN4-dependent occupancies plotted in (C). (D-G)BUR2::myc strains (HQY1052, HQY1055, HQY1053) were grown at 25°C to OD600 of ∼0.6, transferred to 37°C for 30 min and treated with SM for another 30 min at 37°C. ChIP analysis was conducted as described above using H14 antibody (D), RPB3 antibody (E), or myc antibody (F). Values for BUR2-myc in (F) were normalized to those for RPB3 in (E) to calculate the ratios in (G). (H) SPT5::myc strains (HQY971, HQY973, HQY1040) were subjected to ChIP analysis as above. The error bars in this and all subsequent figures correspond to standard errors of the mean.
