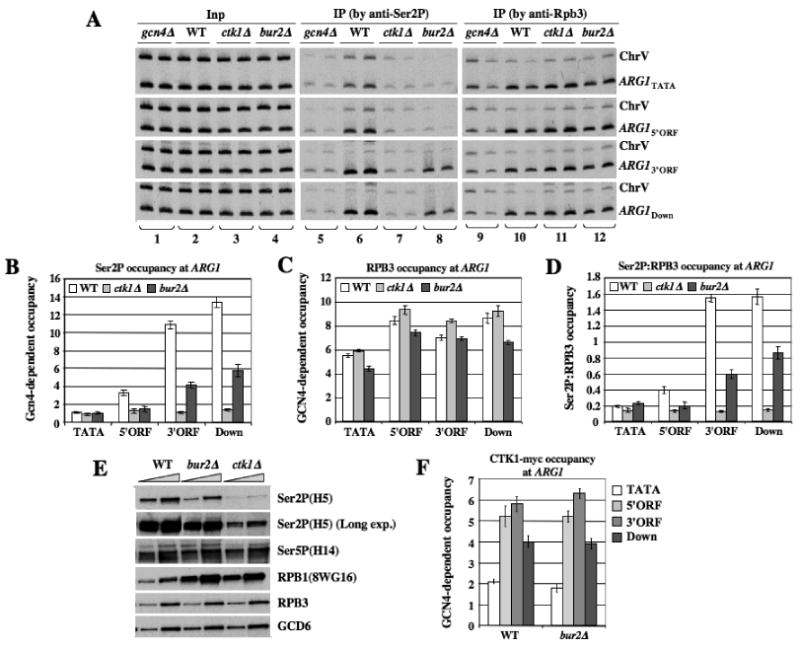
Figure 4. bur2Δ reduces Ser2P occupancy at the 5′ end of ARG1.

(A-D) Strains with the indicated mutations (249, BY4741, 7028, HQY1038) were subjected to ChIP analysis as described in Fig.1 using antibodies for Ser2P or RPB3, with representative results shown in (A). (B-C) GCN4-dependent Ser2P or RPB3 occupancies were calculated as described in Fig. 1 (ie. normalizing for ChrV signals) and ratios of these occupancies are plotted in (D). (E) WCEs of strains with the indicated mutations prepared under denaturing conditions (TCA extraction) were subjected to Western analysis with the indicated antibodies against Ser2P, Ser5P, or hypophosphorylated RPB1 (8WG16), or against RPB3 or GCD6. (F) CTK1::myc strains (HQY1010, HQY1012, HQY1108) were subjected to ChIP analysis as in Fig.1.
