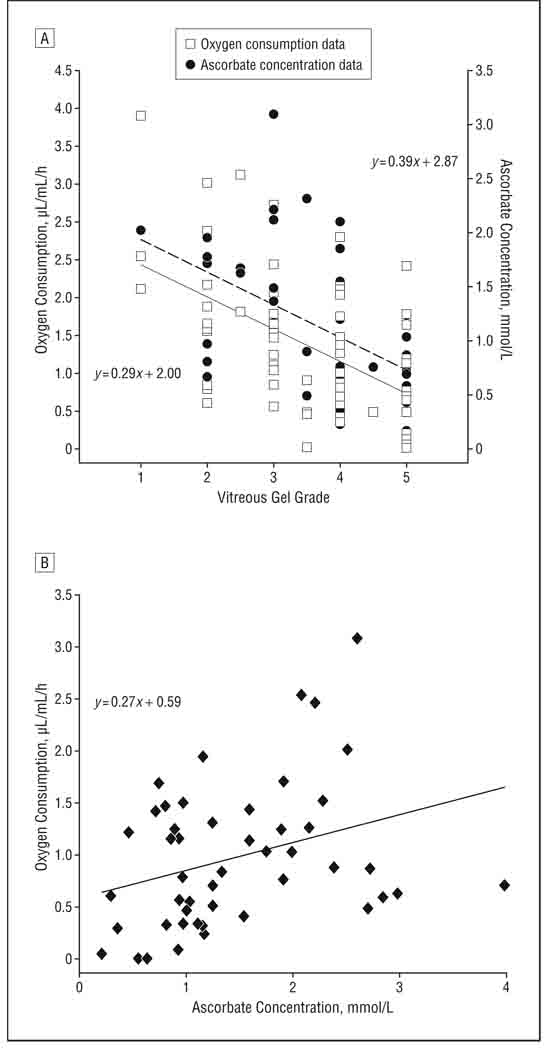
Figure 4.
Scatterplots of oxygen consumption and ascorbate concentration. A, Oxygen consumption and ascorbate concentration relative to the vitreous liquefaction score of samples obtained from patients with no previous vitrectomy. Lower liquefaction score indicates a firmer gel; higher numbers are more liquid. The best linear fit to the oxygen consumption data is shown by the dashed line and that to the ascorbate concentration by the solid line. B, Relationship between oxygen consumption and ascorbate concentration for the 48 samples in which both were measured.

