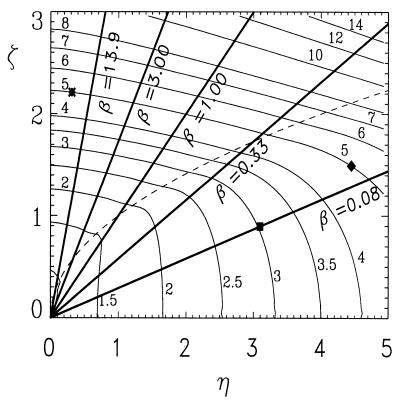
Figure 3.
Contour plot of F(η, ζ) with straight lines ζ =  η superimposed. The dashed line is the line η = ζ2. ∗, ■, and ⧫ denote three of the cases discussed in the text: the mature oocyte, the immature oocyte, and the myocyte in overload, respectively. The latter two are such that η > ζ2 and thus correspond to saltatory waves. For ∗, η ≪ ζ2, and the propagation is continuous.

