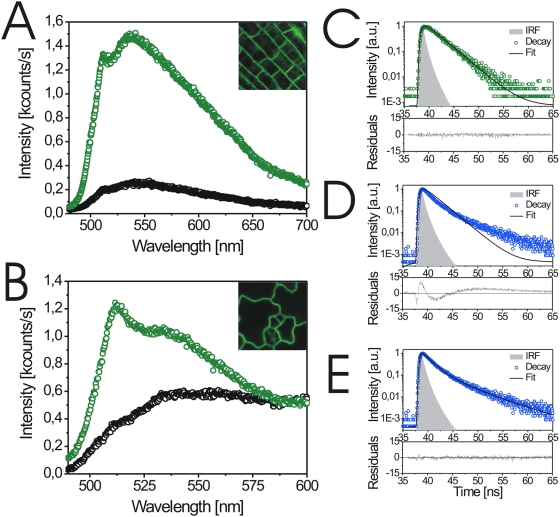
Figure 1. Differentiation of autofluorescence and the GFP signal in BRI1-GFP-expressing and wildtype Arabidopsis cells.
(A–B) Wavelength-resolved fluorescence spectra from plasmalemma-cell wall sections of BRI1-GFP-expressing cells (green) and wildtype cells (black). The spectra were recorded in root, A, or cotyledon cells, B. The areas (50×50 µm) used for recording are shown in the inlets. (C) In vivo decay trace of fluorescence lifetime from BRI1-GFP expressing hypocotyl cells fitted by a mono-exponential function (black line). The lifetime decay was measured at the peak of fluorescence intensity at 500 to 512 nm. (D) In vivo decay trace of autofluorescence lifetime in the plasmalemma-cell wall area of wildtype hypocotyl cells fitted by a mono-exponential function (black line). (E) In vivo decay trace of autofluorescence lifetime in the plasmalemma-cell wall area of wildtype hypocotyl cells fitted by a multi-exponential function (black line). The lifetime decay was measured at around 500 to 512 nm. The residuals indicate the deviation between the measured and the model decay function. In a good fit the residuals are distributed symmetrically around 0. IRF, instrument response function.

