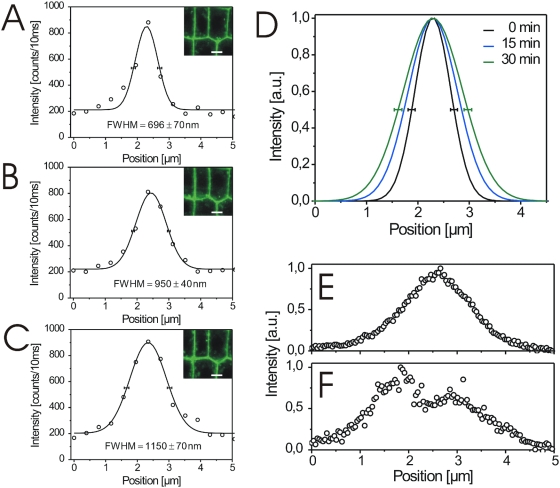
Figure 4. BL-induced expansion of the GFP fluorescence in BRI1-GFP expressing root tips and hypocotyl cells.
(A–C) Fluorescence intensity images and the corresponding profiles (Gaussian fits including FWHM values) of root tip cells recorded over the subcellular section indicated by the white line (representing 5 µm) shown in the confocal image inlets before (0 min) A, 15 min, B, and 30 min, C, after addition of 10 nM BL. (D) Combined Gaussian fits of the intensity profiles shown in A–C. (E–F) Fluorescence intensity profiles recorded over a 5 µm section of the plasmalemmata-cell wall area of two neighbouring hypocotyl cells before, E, and 30 min after application of 10 nM BL, F. For the determination of the FWHM error see Material and Methods. For the statistical analysis of the BRI1-GFP fluorescence measurements see Table S2.

