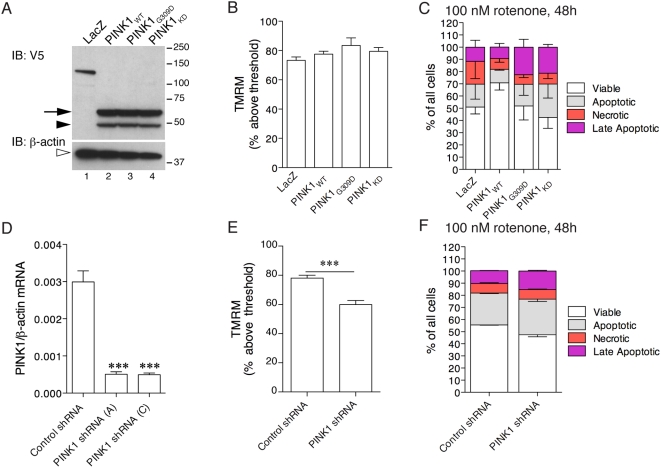
Figure 1. PINK1 expression alters mitochondrial function and cellular viability.
(A–C) Stable overexpression of PINK1 variants. (A) Western blot of stable cell lines generated using lentiviral transduction and selected for equal expression of PINK1. A control lentivirus expressing LacZ is shown in lane 1, lanes 2–4 are cell lines expressing wild-type (WT), G309D or kinase dead (KD) PINK1. The PINK1 in these cells is V5-tagged at the C-terminus, the precursor (arrow) and mature (closed arrowhead) forms of PINK1 are visible. In the lower panel, the blot was reprobed with β-actin to show equal loading. Molecular weight markers on the right are in kilodaltons. (B) Mitochondrial membrane potential was measured using FACS in live cells using TMRM. Results are expressed as the mean number of cells with TMRM fluorescence above threshold set by depolarizing one set of cells with CCCP (100 µM, 10 minutes; see Supplementary Fig. S1). Error bars show the SEM (n = 6–7 independent experiments per line). There are no statistically significant differences between the lines (P = 0.23 by ANOVA). (C) Cell viability was measured after exposure of cells to 100 nM rotenone for 48 hours using FACS. Viable cells were defined as AnnexinV (AnnV) and propidium iodide (PI) negative, and are expressed as percentage of all sorted cells; apoptotic cells were AnnV positive/PI negative; necrotic cells were AnnV negative/PI positive; late apoptotic cells were AnnVpositive/PI positive. Each bar is the mean of 3 experiments with 10,000 cells counted in each, and error bars indicate the SEM between experiments. The improvement in cell viability was significant for cells expressing WT PINK1 only (p = 0.03). (D–F) Stable knockdown of PINK1. (D) Bars show the mean relative PINK1 expression estimated using quantitative RT-PCR, normalized to β-actin expression. Two different PINK1 shRNA sequences, A and C, decrease endogenous mRNA expression relative to a non-specific control shRNA. The differences between the cell lines were assessed using one-way ANOVA (P<0.0001 overall) and Dunnett's multiple comparison post hoc tests when compared to the control shRNA cell line; ***, P<0.0001 (n = 6 independent experiments, error bars indicate the SEM). (E) Mitochondrial membrane potential was measured and is expressed as in (B). The differences between control and PINK1 shRNA were significant by t-test (P = 0.0008, n = 5 independent experiments). (F) Cell viability after rotenone exposure, as in (C), was lower in PINK1 deficient cells compared to control shRNA. The difference in the percentage of viable cells was significant (P = 0.009 by t-test, n = 3).

