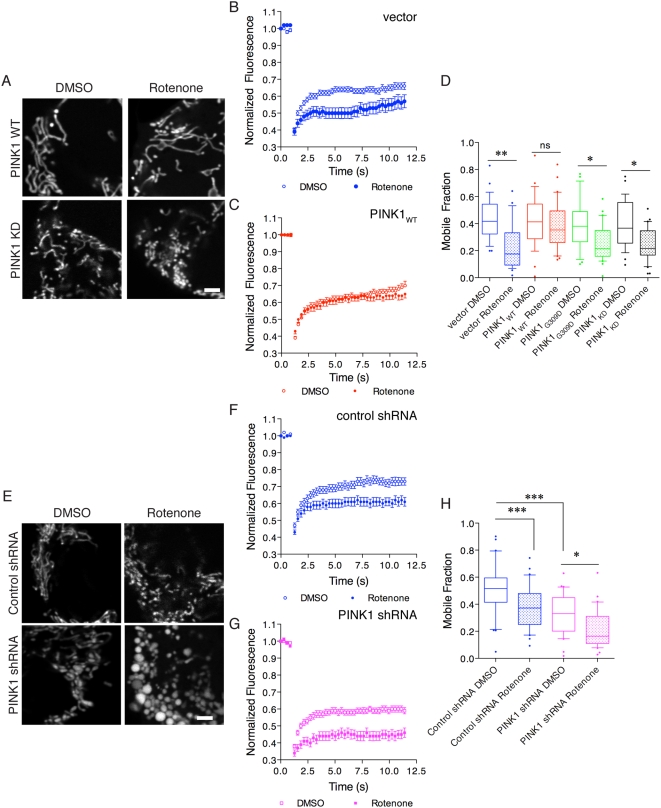
Figure 3. PINK1 protects against rotenone-induced loss of mitochondrial connectivity.
(A) Living cells were imaged after transfection with mito-YFP. Cells expressing PINK1 had longer mitochondria compared to control lines (kinase dead shown here). Rotenone induced fragmentation in control lines but not in lines expressing PINK1. Scale bar in the lower right panel is 2 µm, applies to all fluorescence micrographs. (B) FRAP curves demonstrate that control cells showed more recovery under control conditions (open circles) than after 24 h exposure to 100 nM rotenone (closed circles). In this experiment, control cells are parental M17 cells that were transfected only with the mito-YFP vector to image mitochondria (labeled vector). (C) In contrast, cells stably transduced with wild-type PINK1 showed very similar FRAP curves whether this was measured in the presence of rotenone (closed circles) or under control conditions (open circles, DMSO was used as a vehicle for rotenone). Cells transfected with G309D or kinase dead PINK1 also responded to rotenone (data not shown). In B and C, each point is the average of >30 separate measurements and is representative of at least triplicate experiments for each line/treatment. Error bars indicate the SEM. (D) Mobile fraction of mito-YFP was measured in the indicated cell lines (colors as in B, filled boxes are rotenone treated). In this and all other plots of mobile fraction, summaries are of 24–30 cells. The box indicates the upper and lower quartiles, central line indicates the median and range bars indicate the 10th to 90th percentile range. Cells lying outside of this range are shown as single points. Differences between treatments were significant overall (P<0.0001 by ANOVA) and Student-Newman-Kuells' post-hoc test was used to evaluate rotenone effects in each line. *P<0.05; ** P<0.01; ***P<0.001; ns = not significant (P>0.05). (E) Cells expressing an shRNA against PINK1 showed some basal evidence of fission, with some fragmented mitochondria visible, and exaggerated responses to rotenone and mitochondrial swelling. Scale bar in the lower right panel is 2 µm, applies to all fluorescence micrographs. (F–H) FRAP analyses as (in B,C) showing control shRNA lines (F) and shRNA against PINK1 (G). Open symbols are untreated cells, closed symbols were treated with 100 nM rotenone for 24 hours. (H) Mobile Fraction values were calculated from FRAP curves as in (D). Differences between treatments were significant overall (P<0.0001 by ANOVA; n = 30 cells, representative of at least three experiments per cell line) and Student-Newman Kuells' post-hoc test was used to evaluate rotenone effects in each line. *P<0.05; ** P<0.01; ***P<0.001; ns = not significant (P>0.05). Additional shRNA sequences are shown in Supplementary Figure S2.

