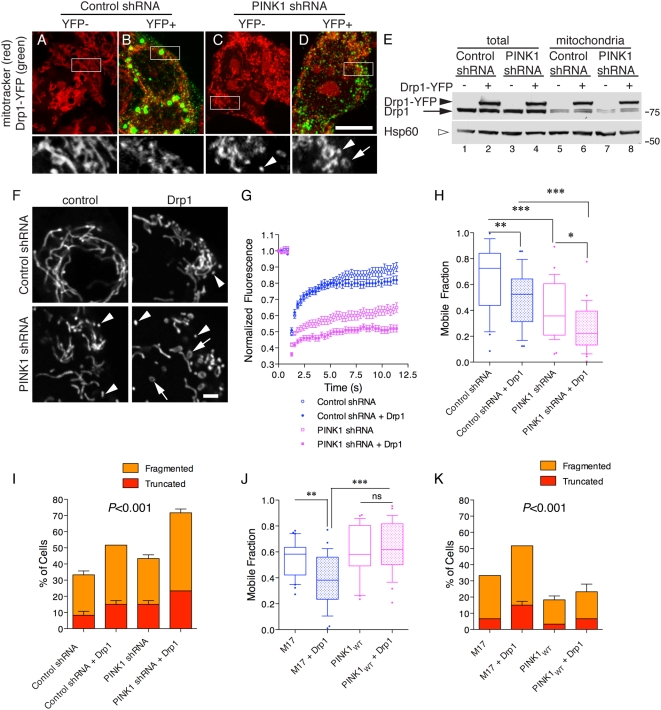
Figure 6. PINK1 deficiency and increased Drp1 expression have additive effects.
(A–D) Control shRNA (A,B) or PINK1 shRNA (C,D) were transfected with YFP-Drp1 (green in upper panels) and stained with mitotracker (red in upper panels; lower panels show an enlarged portion of the mitotracker channel only). At 24 hours after transfection, PINK1 shRNA lines (D) showed more mitochondrial damage than control shRNA lines. Arrowheads show small fragments of mitochondria that are particularly seen in PINK1 deficient cells, arrows show circular fragments that are only seen in PINK1 deficient cells. Scale bar in the lower panel of (D) is 10 µm and applies to all photomicrographs. (E) Control shRNA and PINK1 shRNA cells were transfected with YFP or YFP-Drp1. Total cell lysates or mitochondrial fractions were blotted for Drp1 or Hsp60 as a loading control. Markers on the right are in kilodaltons. (F) Control shRNA (upper panels) or PINK1 shRNA cells (lower panels) were transfected with mito-YFP without (left panels) or with Drp1 (right panels) and live images taken. As in A–D, arrowheads show small fragments and arrows circular remnants of mitochondria. Scale bar in the lower right panel is 2 µm, applies to all fluorescence micrographs. (G, H) FRAP was used to assess the effect of Drp1 overexpression as in figure 3. Open symbols are untransfected cells, closed symbols were transfected with Drp1 for 24 hours. The FRAP curves over time in (G) are the average of 30 observations, representative of duplicate experiments. Error bars indicate the SEM. (H) Summary data for the mobile fractions are shown from n = 30 cells, representative of duplicate experiments. Differences between treatments were significant overall (P<0.0001 by ANOVA) and Student-Newman Kuells' post-hoc test was used to compare each line with and without Drp1 expression. *P<0.05; ** P<0.01; ***P<0.001. (I) Counts of mitochondrial morphology as in figure 2 were performed on 60 cells from duplicate experiments in control shRNA or PINK1 shRNA cell lines. Differences were analyzed by two-way ANOVA using morphology and cell line/treatment as factors and P values for cell groups are given above each graph. (J) M17 or stable PINK1 WT cells were transfected with Drp1. FRAP curves (data not shown) were generated and mobile fractions were derived. (J) Differences between treatments were significant overall (P<0.0001 by ANOVA, n = 30 cells) and Student-Newman Kuells' post-hoc test was used to compare each line with and without Drp1 expression. *P<0.05; ** P<0.01; ***P<0.001. Data is representative of duplicate independent experiments. (K) Counts of mitochondrial morphology were performed on 60 cells from duplicate experiments in control or PINK1 overexpressing cell lines. Differences were analyzed by two-way ANOVA using morphology and cell line/treatment as factors and P values for cell groups are given above each graph.

