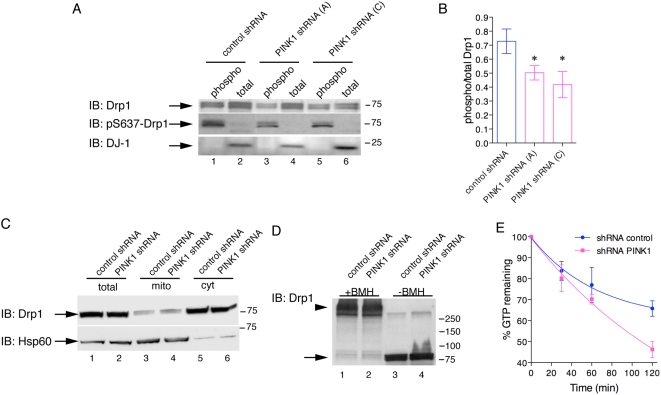
Figure 7. Dephosphorylation and increased GTPase activity of Drp1 in PINK1 deficient cells.
(A) Lysates from control shRNA lines or either of two PINK1 shRNA lines were separated by phospho-enrichment compared to total lysates and blotted for the proteins indicated on the left of the blots. Drp1 was in both phospho-enriched and total fractions, but less phospho-Drp1 was seen in the PINK1 deficient cells. We used phospho-Drp1 to confirm the phosphopurification was efficient and DJ-1 served as a negative control. (B) Quantification of Drp1 as a ratio of the phospho-enriched and total fractions shows that there was an ∼30% decrease in phospho-Drp1 (n = 3) that is consistent between both shRNA sequences (*, P<0.05 by ANOVA). (C) Recruitment of endogenous Drp1 to mitochondrial fractions (mito) is similar in control and PINK1 shRNA cell lines (total: whole cell lysates, cyt: cytosolic fractions). Data are representative of duplicate experiments and molecular weight markers on the right of the blots are in kilodaltons. (D) Oligomerization status of Drp1 is not affected by PINK1 shRNA compared to control lines. Lysates were crosslinked with BMH or not treated to show equivalent loading of Drp1. Arrowhead shows Drp1 oligomers, arrow shows monomeric Drp1. Molecular weight markers are in kilodaltons. (E) GTPase activity of Drp1 immunopurified from control or PINK1 shRNA cell lines was followed over time and expressed as percentage of GTP converted to GDP. The difference between the lines was significant (P<0.01 by two-way ANOVA). Each point is the average of 3 replicates and is representative of two independent experiments.

