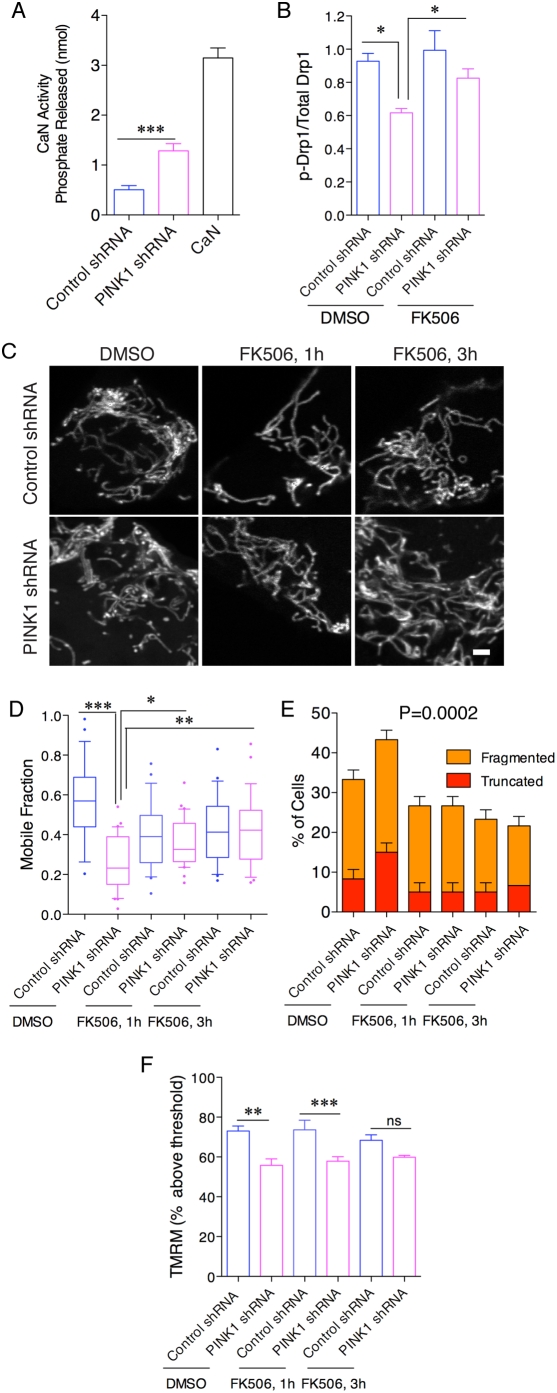
Figure 8. Calcineurin-mediated dephosphorylation of Drp1 contributes to mitochondrial phenotypes related to loss of PINK1.
(A) Calcineurin enzyme activity was measured in postnuclear supernatants of extracts from control and PINK1 shRNA lines. Recombinant calcineurin (CaN) was used as a positive control. Activity is expressed as the release of Pi from a calcineurin substrate peptide, corrected for activity seen in the presence of EDTA to chelate calcium (***, P<0.001.) (B) Cell extracts from PINK1 shRNA lines, treated either with DMSO as a vehicle or 1 µM FK506 for 1 h and enrichment of Drp1 in the phosphorylated fraction was measured as in figure 6B. Quantification (n = 6) confirmed a lower relative amount of phospho-Drp1 in PINK1 shRNA cells compared to controls and a significant increase comparing PINK1 shRNA cells treated with DMSO to those treated with FK506 (*, P<0.05 by ANOVA). All other comparisons were not significant (P>0.05). (C) Mitochondrial morphology in control shRNA and PINK1 shRNA cells was assessed by mito-YFP expression. Cells were treated with vehicle only or 1 µM FK506 for 1 h or 3 h. Increasing length of FK506 treatment improves mitochondrial connectedness, especially in the PINK1 shRNA line. Scale bar is 2 µm and applies to all panels. (D) Mobile fraction values were estimated from FRAP curves either without treatment or after 1 h or 3 h treatment with 1 µM FK506. Each box is the average of 60 measurements from cells across duplicate experiments. *, P<0.05; **, P<0.01, ***, P<0.001 by one-way ANOVA with Student-Newman Kuells' post-hoc test. For clarity, non-significant differences (P>0.05) are not indicated. (E) Counts of mitochondrial morphology as in figure 2 were performed on n = 60 cells from duplicate experiments in control shRNA or PINK1 shRNA cell lines after treatment with FK506 for 1 or 3 hours. Differences were analyzed by two-way ANOVA using morphology and cell line/treatment as factors and P values for cell groups are given above each graph. (F) Mitochondrial membrane potential was estimated in PINK1 knockdown cells using TMRM staining and FACS analysis with and without 1 or 3 h treatment with 1 µM FK506. There is a significant (*, P<0.05; ***, P<0.001, n = 6 independent experiments) difference between the lines under basal conditions or after 1 h treatment by one-way ANOVA with Student-Newman Kuells' post-hoc test, although this is not significant (ns) at 3 h.

