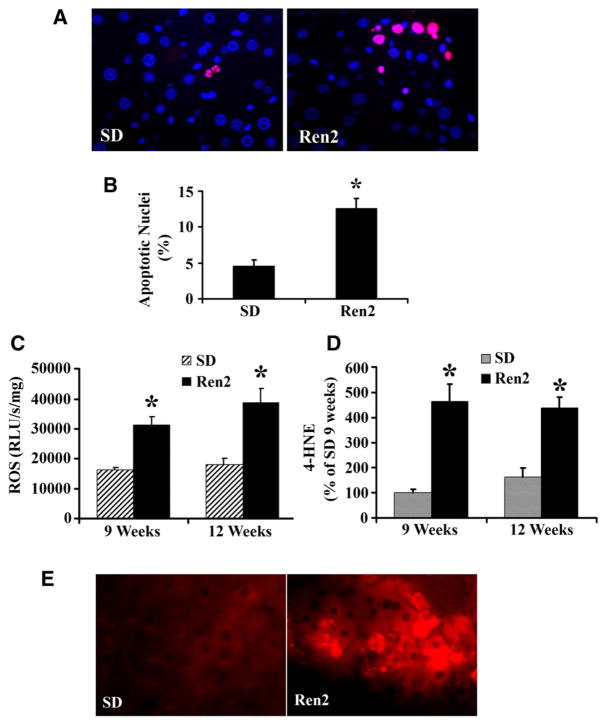
Fig. 4.
Assessment of hepatic apoptosis and hepatic oxidative stress. (A) Representative TUNEL staining showed increased apoptotic cells in Ren2 liver sections compared with SD controls at age 12 weeks (red for apoptotic nuclei; blue for nuclear stained with DAPI). (B) The bars represented the ratio of TUNEL-positive/negative as counted at five random fields in liver sections obtained from 12-week-old Ren2 and SD rats. (C) ROS were detected by the lucigenin assay as described in 2; there was significant increase in the ROS formation in the Ren2 livers compared with SD controls at ages of 9 and 12 weeks. (D) Oxidative stress marker 4-HNE detected by Western blot, the bar graphs represented band densitometries at ages of 9 and 12 weeks. (E) Representative immunofluorescent photomicrographs for oxidative stress marker 4-HNE (red) showed increased staining intensity in Ren2 livers compared with SD controls at age 12 weeks. The results are means ± SEM for 4–5 rats for each group, *p < 0.01, Ren2 vs. SD controls. Magnification: 400×.

